A report tool should help you organize evidence and communicate findings. Some tools draft slides, others analyze data or summarize documents. Start by deciding which part of the reporting process needs support.
This guide compares seven report-related tools by workflow. It does not report a hands-on quality benchmark; evaluate a sample using your own data and required output. Once your notes are organized, the text-to-presentation workflow offers a way to turn that material into an editable slide draft.
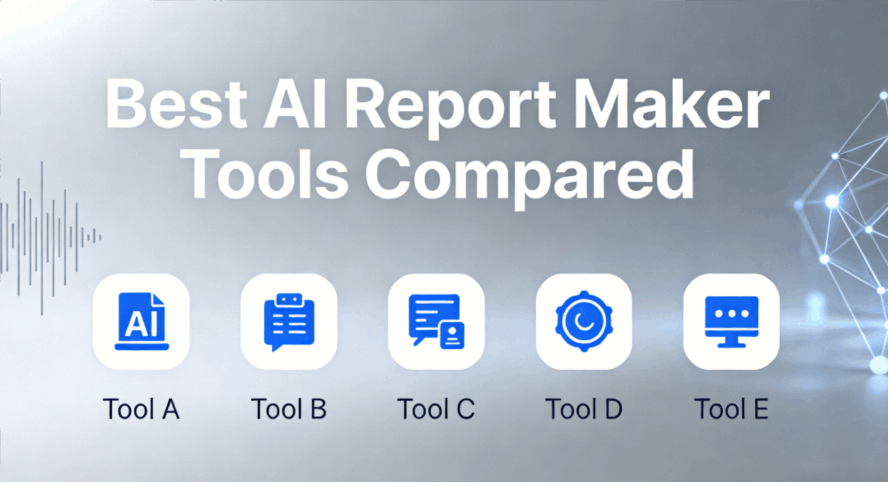
2026 Top AI Report Maker Tools at a Glance
| Tool | Workflow | What to review |
|---|---|---|
| Presenti | Topic and document to slides | Source fidelity, layout, and paid PPTX/PDF export |
| Gamma | Card-based presentation drafting | Online reading and exported slide layout |
| Beautiful.ai | AI drafting and automatic layouts | Smart Slide controls and trial/subscription terms |
| Powerdrill | Data-analysis assistance | Calculations, assumptions, and source traceability |
| Visme | Visual reports and infographics | Chart editing and output format |
| Canva | Visual design and presentation drafts | Template fit and asset licensing |
| Notion AI | Summaries and structured documents | Source context and the need for a separate slide workflow |
Individual Product Reviews: Finding Your Perfect Match
1. Presenti
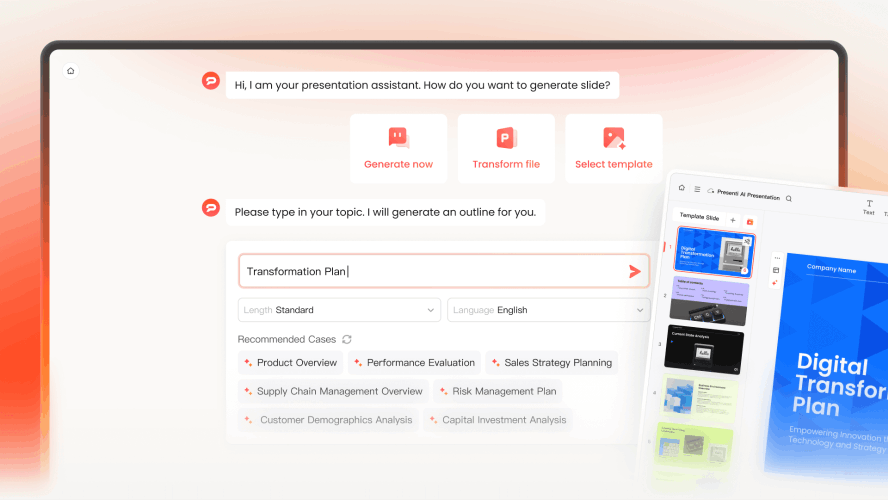
Multi-Format "Intelligence Ingestion"
Presenti can draft slides from a topic or supported source document.
- The Magic: Use supported Word, PDF, TXT, Markdown, or XMind input. Prepare clear headings and check import eligibility and limits for your account.
- Scenario: Imagine having a transcript of a 2-hour board meeting. Instead of spending your Sunday summarizing it, simply drop the file into Presenti. Review the generated summary against the transcript, especially decisions, owners, and dates.
The "One-Click Beautify" & Brand Guardrails
Use a template and adjust its colors, typography, and images to match the report’s purpose and your brand.
- Automatic Consistency: Use your approved logo, colors, and fonts, then check their application across the deck.
- Design Accuracy: Layout suggestions can reduce formatting work. Review long titles, dense charts, and image crops after adding the final content.
Data Storytelling: Beyond Simple Charts
Start with the comparison you want the audience to understand, then choose a chart and explain the relevant finding.
- Smart Visualization: For a hypothetical 20% drop in sales, show the comparison period and source, then explain what is known about the cause. Do not infer a recovery plan from a change in the chart alone.
- Interactive Elements: Keep the underlying data available and update the deck when the approved figures change.
Seamless "Human-in-the-Loop" Collaboration
Use Presenti to prepare a report draft, then check the evidence, add context, and decide which findings matter to the audience.
- Real-time Editing: It works like a Google Doc for presentations. Invite teammates to the workspace and edit the presentation together.
- Pro-Grade Exporting: When you're done, export to a fully editable PPTX. PPTX/PDF export requires an eligible paid plan. Open the exported file in PowerPoint and check fonts, charts, images, and any effects you need.
2. Gamma

Gamma can turn a prompt or source material into a card-based presentation or document. Its creation workflow includes a plan to review before generation and a draft to revise afterward.
Workflow: Use the conversation to clarify the report's purpose and request changes to the plan or draft. Compare the result with the source material before using it for a team update or brainstorm.
Cons: The "card-based" layout can feel a bit light for formal, long-form corporate reports.
3. Beautiful.ai
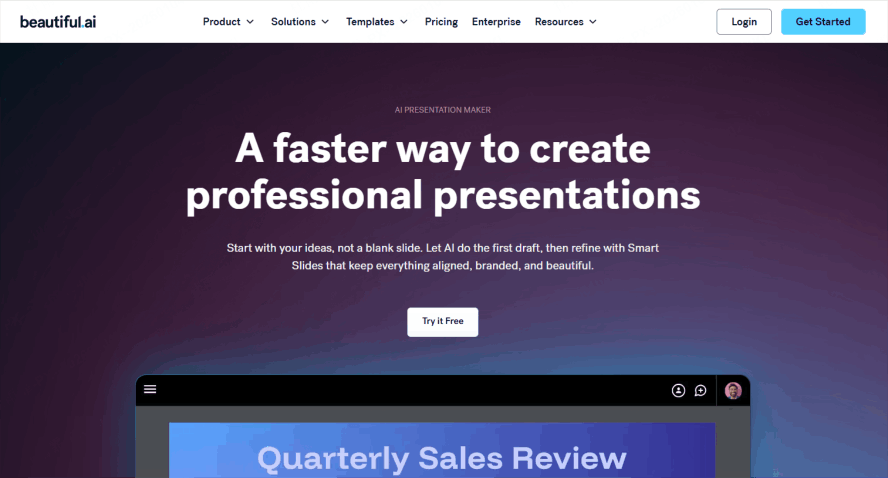
Beautiful.ai combines AI drafting with automatic slide-layout tools. Evaluate it when consistent presentation design is a priority.
Pros: It uses "smart templates" with built-in design rules. If you add a new team member to a chart, the entire slide shrinks and realigns itself automatically.
Check: Try a dense data slide and inspect the available layout and export controls.
4. Visme
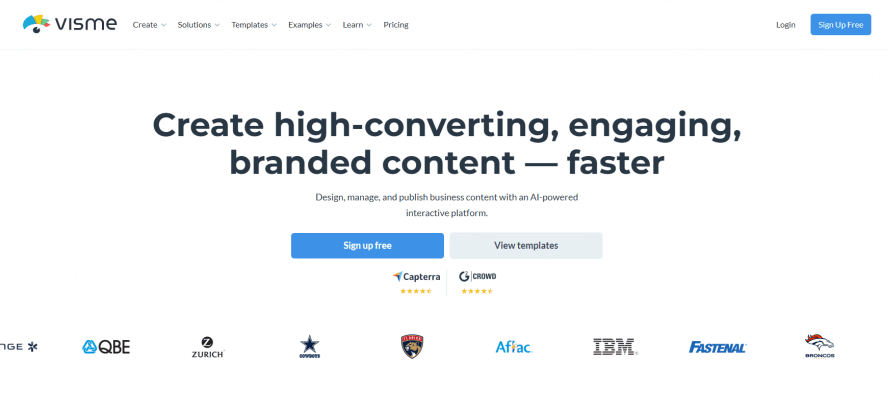
Visme is an ai report maker that excels when you need your reports to be interactive and visually dense. It’s perfect for creating "infographic-style" reports that catch the eye.
Pros: It offers a massive library of icons, videos, and interactive charts. As an automated report generator, it’s excellent for marketing summaries where visual engagement is more important than raw data depth.
Cons: Because it has so many features, the interface can feel cluttered and overwhelming for a first-time user.
5. Powerdrill Bloom
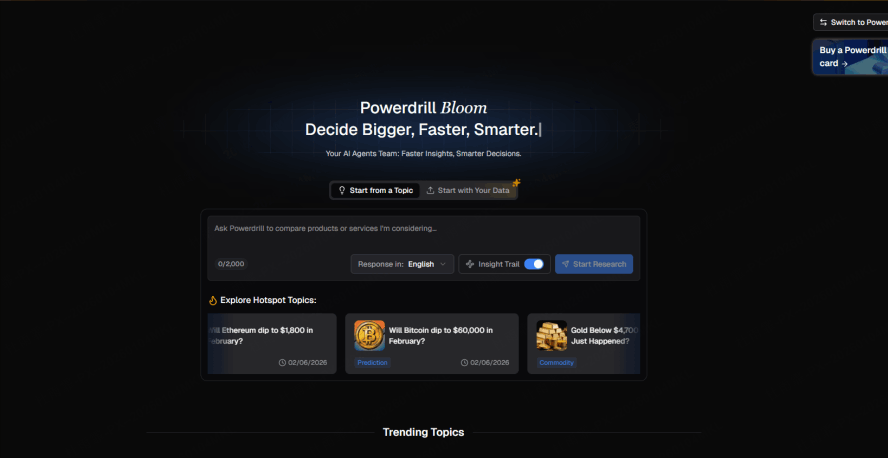
Powerdrill is an option when the reporting task starts with a dataset. Its documentation describes data cleaning, analysis, and report generation. Check the calculations and distinguish observed relationships from explanations of why a change occurred.
Pros: It bridges the gap between raw data to report presentation ai by cleaning your data first. Verify calculations, transformations, and interpretations against the source before using the report.
Cons: The visual output is often more functional than "beautiful."
6. Canva Magic Design
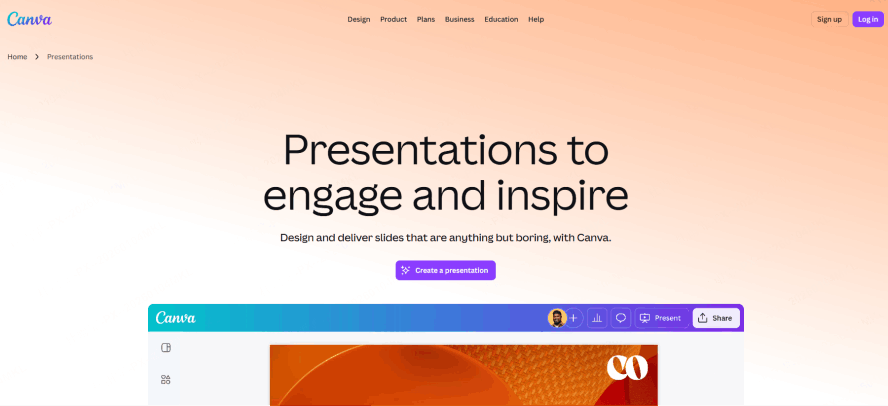
Canva has integrated its "Magic Design" into the reporting world. It’s an ai report maker that feels familiar to almost everyone.
Pros: Millions of stock photos and a very low learning curve. It’s a decent automated report generator for school projects or small business updates.
Check: Choose a template with room for the report’s evidence and verify the draft’s structure yourself.
7. Notion AI
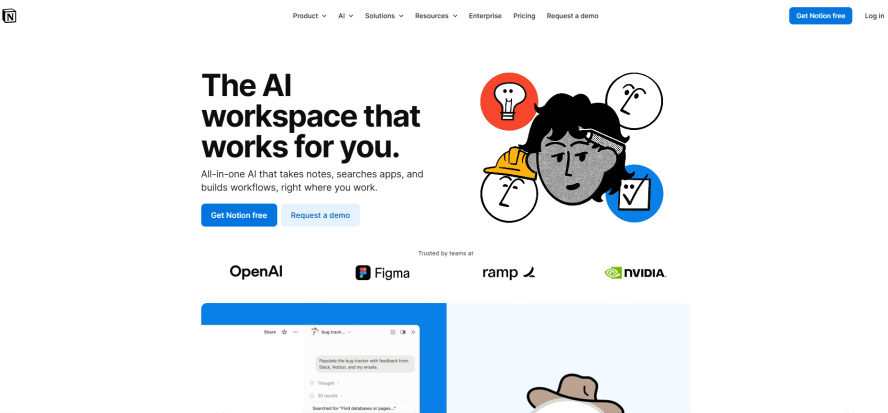
Notion AI is best for teams that already live inside the Notion ecosystem. It is perfect for turning meeting notes into a structured progress report.
Pros: It creates structured, clean-looking documents and summarizes long threads of text instantly.
Cons: It is primarily text-based. Its data to report presentation ai features are very basic, making it unsuitable for visual presentations.
Pro Tip for Choosing a Report Tool
When searching for the best ai report maker, don't just look at the price tag. Here are three expert strategies to ensure you get the best ROI:
The Comparison Landing Page Strategy: If you're deciding between two tools, check for specific "vs" pages (like presenti.ai/vs/gamma). These pages often highlight the granular differences that a general review might miss.
Visual Evidence is Everything: A true automated report generator should be able to show you its "quality" before you sign up. Always look for high-quality AI-generated report screenshots. Screenshots illustrate appearance, but only your own sample can show the editing and export work your report will need.
Focus on the argument: A report should connect its evidence to a clearly stated finding or decision. Compare that connection in your own sample rather than assuming one tool has better narrative logic than all competitors.
Conclusion
Choose the report tool for the work you need to complete: analyzing data, preparing a written report, or designing slides. A generated draft still needs your evidence, interpretation, and review before it is ready for the audience.
Try a short report draft in Presenti, then compare it with your source material and the output requirements for your meeting.