A science fair presentation should make the path from your question to your conclusion easy to follow. Show what you changed, what you measured, the individual results, and what those results can reasonably tell you. You do not need to make an imperfect experiment sound perfect. You need to explain it accurately.
Start with the notebook from the experiment you have already completed. Once the question, observations and explanation are organized, you can use Presenti to turn classroom notes into a presentation draft. Keep your notebook beside you while editing: the slides should reflect your measurements, not introduce a more impressive result.
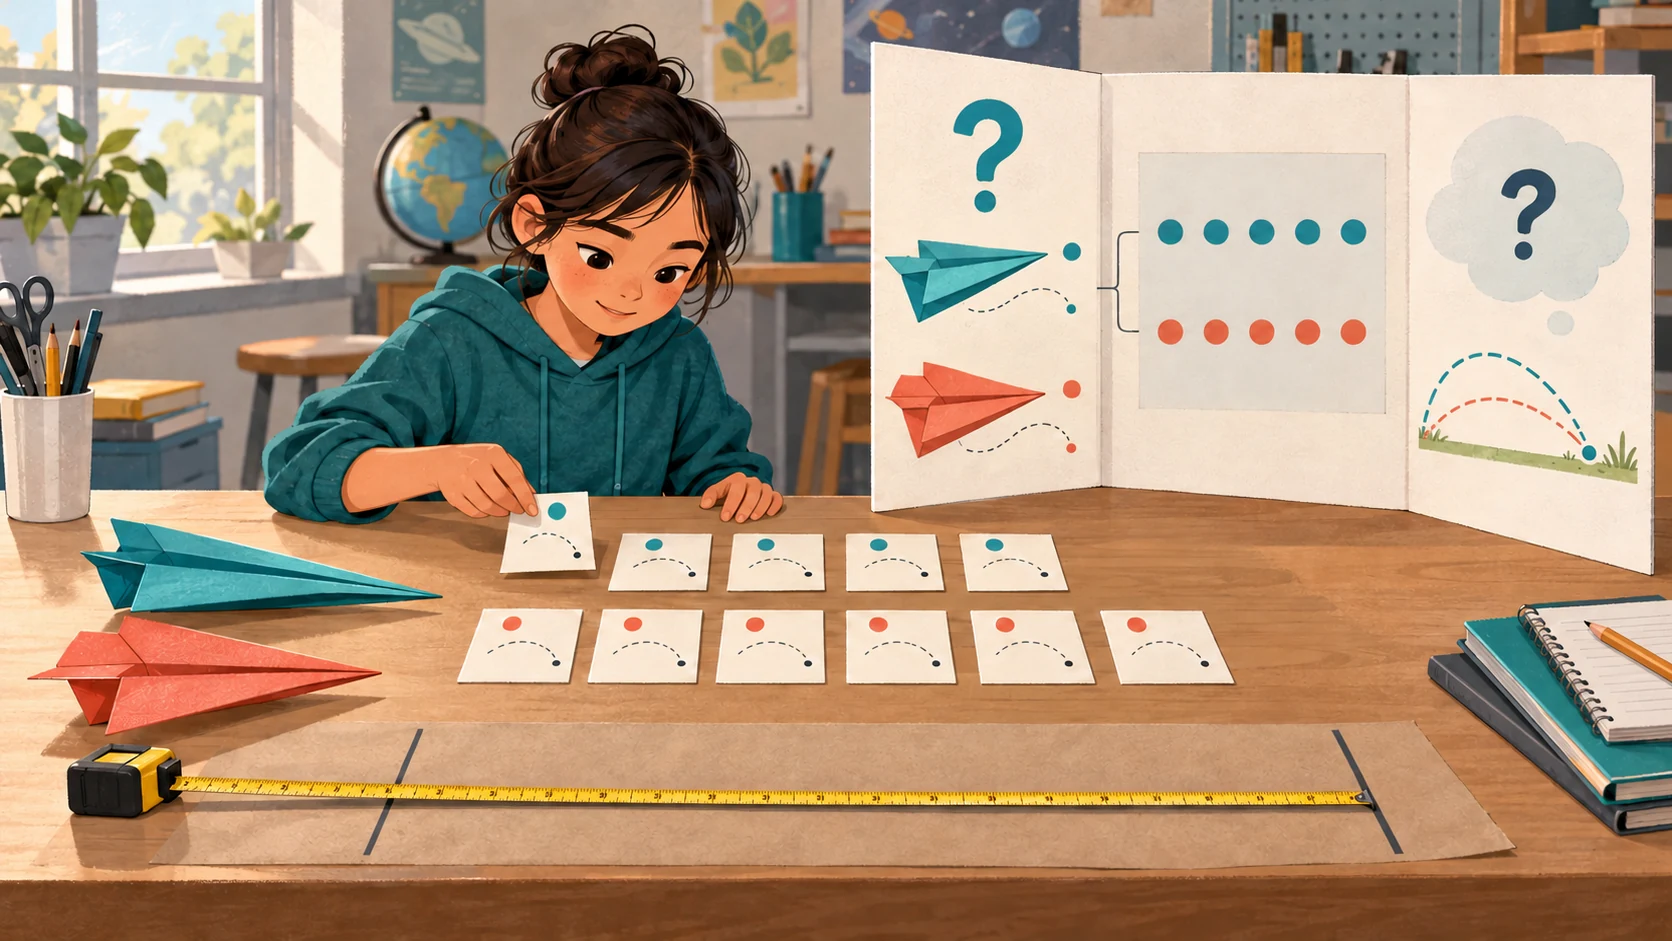
Find the question in your notebook
A project title such as “Paper Airplanes” names a subject but does not tell the audience what you investigated. A more useful starting sentence identifies the comparison and the measurement: “Which of two paper airplane designs travels farther under these test conditions?”
Then separate your prediction from your result. A prediction records what you expected before the measurements. The conclusion explains what the measurements support afterward. If the result surprised you, that difference gives you something worthwhile to discuss; it is not a reason to rewrite the prediction.
Gather four kinds of material before arranging slides: your original question and prediction, the procedure you actually followed, the complete observation record, and notes about anything that went wrong. Keep photographs, sketches and sources with the part of the explanation they support. A photograph can show a setup or a design detail, but it cannot replace missing measurements.
A worked example: comparing two paper airplane designs
The following is an illustrative classroom example, not a report of an experiment conducted for this article. It shows how to present a small set of observations without turning them into a claim they cannot support.
The example compares designs A and B, with five recorded throws for each. Its recording convention is the horizontal distance from a marked indoor starting line to the plane's first landing point, measured in meters. Both designs use the same type and size of paper, the same thrower and the same starting line. Throwing force was not controlled.
Use those conditions to build a short explanation:
- Question: Which design has the greater average distance across five throws in these conditions?
- Prediction: Design B will have the greater average distance.
- Changed factor: The airplane design, labeled A or B.
- Measured outcome: Horizontal distance to the first landing point, in meters.
- Remaining uncertainty: The thrower may have used different amounts of force or different release angles.
A and B are labels, not instructions for folding a plane. In your own presentation, show a sketch or photograph that explains the actual difference between your designs. If you recorded a reason for your prediction, include it. Do not add an aerodynamic explanation you cannot connect to your design or a reliable source.
Show every recorded throw before the average
| Recorded throw for each design | Design A distance (m) | Design B distance (m) |
|---|---|---|
| 1 | 4.2 | 5.1 |
| 2 | 4.6 | 4.9 |
| 3 | 4.1 | 5.4 |
| 4 | 4.8 | 5.0 |
| 5 | 4.3 | 5.6 |
| Mean | 4.4 | 5.2 |
The row numbers identify each design's recorded throws. They do not establish that corresponding A and B throws were performed as matched pairs or in an alternating order; that information is not part of the example record.
For A, the five distances total 22.0 m; dividing by five gives 4.4 m. For B, the total is 26.0 m and the mean is 5.2 m. The difference between the means is 0.8 m. Keep the unit with the result so the audience knows whether you measured distance, time or something else.
A two-group dot plot is useful here: show five points for A and five for B on one distance scale, with each group's mean marked separately. The table preserves the exact values, while the plot lets the audience see the spread. Do not replace five throws with a single “best flight” or quietly remove the shortest one.
If one of your own measurements was invalid, explain the reason and how you handled it. A plane hitting a wall before its natural landing would raise a different issue from a short but otherwise valid flight. Decide from what happened and your measurement rule, not from whether keeping the number improves the result.

Write a conclusion the data can support
For this example, a defensible result sentence is: “Across these five throws per design, B's mean distance was 5.2 m and A's was 4.4 m, a difference of 0.8 m.” The prediction is consistent with this set of observations.
That sentence is narrower than “B is the best paper airplane.” Only two designs appear in the record, and throwing force was not controlled. A small set of observations does not establish how either design will behave with every thrower, outdoors or under different launch conditions.
Put the main limitation next to the conclusion: “Some of the difference could come from how the planes were thrown.” This helps the audience understand the result while it is in front of them. It is more useful than adding a vague warning at the end of the presentation.
Do not label the difference “statistically significant” because one mean is higher. This example includes no statistical test or design that would justify that claim. The useful achievement is the clear comparison and an honest explanation of what remains uncertain.
For a next round, choose an improvement that addresses the uncertainty. You could define and record a more consistent release method, record the order of throws, and repeat the comparison. More throws would add observations, but simply repeating an inconsistent procedure would not remove the problem with throwing force. Explain what your proposed change is meant to improve.
Map the notebook to seven purposeful slides
This seven-slide structure is a starting point for a short talk. Adapt it to the actual instructions and time available. Its value is the connection between the slides: the result answers the question, and the next step addresses a weakness in that answer.
| Slide | Take this from your notebook | Put this on screen |
|---|---|---|
| 1. Question | The comparison you investigated | One question and a clear identification of A and B |
| 2. Prediction | What you expected before testing | The prediction and your recorded reason, if you have one |
| 3. Method | What changed, what stayed the same, and how you measured | A setup sketch and the few conditions needed to understand the comparison |
| 4. Observations | All recorded results, with units | The ten example points on a common distance scale |
| 5. Interpretation | The calculation and the pattern you noticed | The two means, their difference, and the limited conclusion |
| 6. Uncertainty | Unexpected events or uncontrolled conditions | The throwing-force limitation and why it matters |
| 7. Next investigation | What you would change or ask next | One improvement tied to the limitation, followed by the original question |
For a shorter slot, combine the prediction with the question and the uncertainty with the conclusion. Keep the observations visible. Removing the data slide to make room for decoration would remove the audience's best opportunity to understand your reasoning.
To adapt the mapping to your own project, complete these lines in your notes before opening a slide editor:
- I compared ___ with ___ to find out ___.
- I predicted ___ before testing because ___.
- I changed ___, measured ___ in ___, and kept ___ the same.
- My complete observation record is ___.
- The pattern in those observations was ___.
- This supports ___ under ___ conditions, but it does not establish ___.
- Next, I would change ___ so I could learn ___.
If a line cannot be completed from your notebook, leave a question for yourself. Look for the missing record or explain the gap. Do not ask a slide generator to supply an observation, a source or a result that you did not collect.
Explain the result out loud
The result slide should carry the evidence while you explain the relationship. For the example, a short spoken passage could be:
“Each point is one throw. A averaged 4.4 meters and B averaged 5.2 meters, so B traveled farther on average in these observations. That agrees with the prediction. However, throwing force was not controlled, so the record cannot separate the design's effect from differences in the throws. In another round, I would make the release method more consistent and record the throw order.”
Point to the relevant group as you name it. Pause after the difference so the audience can compare it with the individual points. You do not need to recite all ten numbers, because the table and plot retain them for inspection.
Practice with the slide, then without reading its sentences. If the explanation becomes difficult when you stop reading, identify the missing connection: how the measurement answers the question, how the mean was calculated, or why the limitation affects the conclusion. Repair that connection before adding more text.
Answer questions without inventing certainty
“How do you know the design caused the difference?”
“These observations show a difference between the two groups, but they do not isolate design from throwing force. I would need a more consistent release method to investigate that.” This answers the question directly without discarding the useful measurements you do have.
“Did you alternate the designs?”
“The example record does not include the throw order, so I cannot say. I would record it in the next round.” In your own talk, answer from your notes. It is better to identify a missing detail than describe an orderly procedure that did not happen.
“Would B win with someone else throwing?”
“This comparison used one thrower. Trying other throwers would be a new question, and I would need to plan how to keep the comparisons useful.” Do not extend a result to a different situation merely because the story would sound stronger.
Finish by returning to the question and the measured answer. Keep your full table, design sketch and notes available for discussion. A clear science fair presentation lets another person see both why you reached your conclusion and what you would investigate next.