A software migration business case should answer whether changing systems is worth the cash, disruption, and delivery risk compared with keeping the current system. A cheaper annual subscription is not enough. Compare the same scope over the same period, include the months when both systems run, and identify the assumption that could reverse the recommendation.
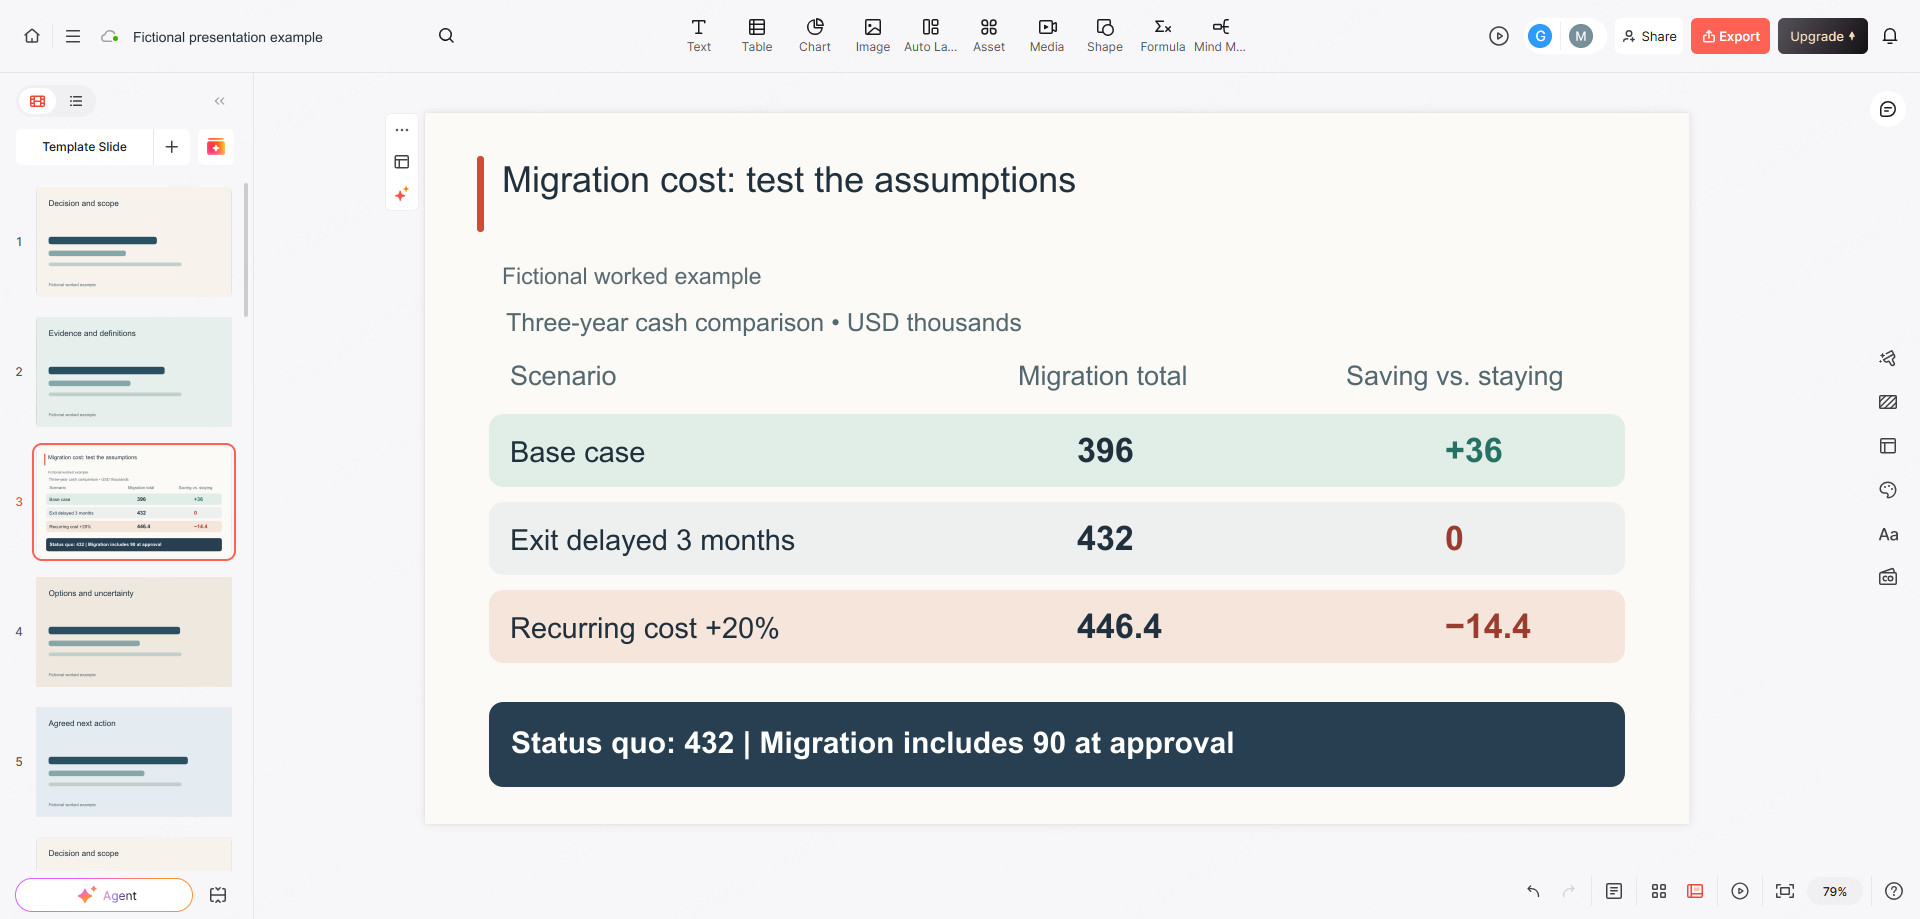
In the fictional example below, the replacement saves $60,000 a year once the old system closes, but only $36,000 across the three-year decision window. Three additional months of overlap eliminate that saving. The presentation needs to show both numbers.
Once finance and the system owner have agreed the inputs, use Presenti to turn the decision brief into an editable slide draft. Keep calculations in the financial model. Presenti helps organize the narrative; it does not validate the economics or migrate software.

Compare migration with a credible status-quo option
Start with a decision that can actually be approved: “Should we fund a replacement for the internal case-management system this quarter, or continue the current service for three years?” Specify the same users, essential workflows, service level, currency, and evaluation horizon for both options. A low-price replacement can otherwise look attractive simply because it delivers less.
Imagine a company supporting 100 users on a still-supported internal system. It can renew that system or migrate to a replacement supporting the same core tasks. The incumbent is not assumed to become unusable next year, so continuing it is a credible alternative, not a straw man.
If a real support deadline or mandatory requirement makes continuation impossible, compare compliant alternatives instead. Do not present an infeasible status quo as a money-saving option. A staged migration, if realistic, needs its own dated costs rather than inheriting all the savings of a faster move.
The GAO Cost Estimating and Assessment Guide identifies scope, a technical baseline, assumptions, sensitivity analysis, and updates with actual costs as parts of a reliable estimate. Apply that discipline to the decision; the slides are a view of the estimate, not a substitute for it.
Show three years of cash costs, including the overlap
The following costs are invented for the worked example. Amounts in the table are USD thousands. Year 0 is approval; Years 1–3 are the following three years.
| Cash cost | Year 0 | Year 1 | Year 2 | Year 3 | Total |
|---|---|---|---|---|---|
| Continue: existing licenses, infrastructure, and support | 0 | 144 | 144 | 144 | 432 |
| Migrate: implementation and exit preparation | 90 | 0 | 0 | 0 | 90 |
| Migrate: old system during three-month overlap | 0 | 36 | 0 | 0 | 36 |
| Migrate: replacement licenses, infrastructure, and support | 0 | 84 | 84 | 84 | 252 |
| Migrate: temporary transition support | 0 | 18 | 0 | 0 | 18 |
| Migrate: total cash outflow | 90 | 138 | 84 | 84 | 396 |
| Incremental cash flow: continue minus migrate | −90 | 6 | 60 | 60 | 36 |
The $90,000 at approval comprises $60,000 of implementation, $20,000 of data mapping and validation, and $10,000 of cutover and archive preparation. The separate $18,000 pays for temporary transition support; it is not a second charge for the same implementation work. Employee salaries remain unchanged in both options, so the table claims no payroll saving.
The current system costs $12,000 a month. Three months of overlap cost 3 × $12,000 = $36,000. The replacement costs $84,000 for each full year from Year 1, even while the old system remains live. Do not count a full year of avoided incumbent costs and then quietly allow an overlap period.
The three-year calculation is $432,000 − $396,000 = $36,000 in undiscounted savings. The steady-state difference, $144,000 − $84,000 = $60,000 per year, excludes initial and transition costs. Neither is revenue or a verified return on a real project.
Expose the assumptions that control the result
The fictional base case assumes the incumbent can be cancelled monthly after the three-month overlap, replacement prices stay fixed, user count is unchanged, and no extra implementation work is charged after Year 0. A different contract can change the answer even when the software works perfectly.
| Input | Fictional base case | Evidence needed in a real proposal |
|---|---|---|
| Current operating cash | $144,000 a year | Renewal terms, infrastructure bills, and avoidable support costs. |
| Replacement operating cash | $84,000 a year | Quoted scope, usage assumptions, support level, and renewal terms. |
| Initial migration cash | $90,000 at approval | Scoped statement of work, payment dates, dependencies, and exclusions. |
| Old-system overlap | Three months at $12,000 a month | Notice period, cancellation rights, and credible cutover readiness. |
| Temporary support | $18,000 in Year 1 | Transition staffing plan and the condition that ends extra support. |
This is a simplified before-tax cash comparison with no inflation, exchange-rate movement, terminal value, or revenue benefit. Sunk expenditure is excluded because it is already spent; future payments that differ between the options are included. These are explicit modeling choices, not a claim that such factors never matter. For a real proposal, finance determines the horizon, tax treatment, price basis, and residual obligations.
Keep internal effort visible in a separate capacity line even when cash does not change. Reassigning employees has a delivery consequence, but it does not automatically remove their salaries from the budget. Name the displaced work rather than converting recovered time into unsupported cash savings.
Explain cash timing before showing NPV or payback
For an optional discounted view, the incremental cash flows are −90, +6, +60, +60, in USD thousands. With a purely illustrative annual discount rate of 10%, treating Years 1–3 as year-end flows:
NPV = −90 + 6 / 1.10 + 60 / 1.10² + 60 / 1.10³ = +10.12
That is approximately $10,120 of incremental net present value, not $36,000. The 10% rate is a demonstration input, not a recommended corporate hurdle rate. Use the approved rate and timing convention for an actual proposal. Material payments on specific dates require a dated model instead of a year-end simplification.
In Excel, the example is =-90+NPV(10%,6,60,60). Microsoft’s NPV documentation specifies equally spaced end-of-period flows. The immediate $90,000 outflow belongs outside the NPV argument list; including it as the first future value shifts the timing.
Undiscounted cumulative cash is −$90,000 at approval, −$84,000 after Year 1, −$24,000 after Year 2, and +$36,000 after Year 3. The annual table shows recovery within Year 3. It does not establish an exact payback month; use actual monthly payment and saving dates for that claim.
Recalculate the changes that could overturn the case
A sensitivity slide changes an input and recalculates the same model. Adding a red risk icon beside an unchanged savings figure does not do that. Here, the key exposures are how long the incumbent remains payable and what the replacement costs.
| Scenario | Migration cash total | Saving versus continuing | Incremental NPV at illustrative 10% | Decision implication |
|---|---|---|---|---|
| Base case | $396,000 | +$36,000 | +$10,120 | Positive financial case, with limited headroom. |
| Overlap grows from three to six months | $432,000 | $0 | −$22,607 | No nominal cost advantage remains in this horizon. |
| Replacement recurring cost rises 20% in all three years | $446,400 | −$14,400 | −$31,659 | Cost reduction alone no longer supports migration. |
The delay adds 3 × $12,000 = $36,000 in Year 1. The higher-price case adds 20% × $84,000 × 3 = $50,400. These are not probability forecasts. If both changes can occur together, model a combined case separately; one-variable tests are not automatically a worst case.
The defensible message is now “the three-year case is positive only with controlled overlap and recurring cost,” not simply “we save $60,000 a year.” A documented security or service requirement may still justify a costlier option. Name that objective and its evidence separately rather than inventing avoided outage losses or revenue gains to make the financial column positive.
Tie funding to evidence, not just a target date
Investment approval commits budget; permission to stop the old system depends on operational evidence and contract terms. A date alone proves neither. Request staged approval: confirm recurring prices and exit terms before implementation commitment; accept representative workflows and the data-reconciliation approach before cutover; confirm that the incumbent charge can stop before recognizing the saving.
Name the person accepting each result and the financial assumption it protects. If implementation evidence is inadequate, the next decision may be a narrower scope, a bounded investigation, or retaining the current system. If exit slips, recalculate the overlap row before repeating the original saving. These are investment consequences, not a detailed technical runbook.
After a go decision, use the separate product retirement presentation guide for affected user tasks, replacement routes, and notices. This deck owns the earlier question: whether and under what conditions to invest.
Give each of six slides a decision job
Keep the spreadsheet and quotes as the model of record. Use the presentation to make the choice understandable:
- Decision requested: migrate now, retain the current system, or approve a smaller investigation. Name scope and decision-maker.
- Comparable options: show the same 100 users and core tasks, plus any material capability difference.
- Three-year cash: show the $432,000 and $396,000 totals and the $90,000 initial outlay.
- What changes the answer: put delay and recurring-cost scenarios beside the base case.
- Funding conditions: connect approval gates to contractual, technical, and operational assumptions.
- Recommendation: state the choice supported now and the unresolved condition that would change it.
Use those headings to prepare the text for Presenti, with approved figures, units, scenario labels, and recommendation beneath them. Ask the draft to preserve the fictional-example label and the distinction between total cash saving and annual run-rate reduction. Do not ask it to estimate missing costs from a software name.
Compare the draft with the model, especially negative signs, USD-thousands units, timing, and the word “proposed.” Correct a chart that loses the initial outlay or a scenario label.
A decision-ready closing statement for the fictional case is: “Proceed only after the replacement quote and three-month exit assumption are supported. The base case saves $36,000 over three years, but three additional months of overlap remove that nominal benefit. If those conditions cannot be met, return with a revised option rather than approving on the $60,000 annual headline.”