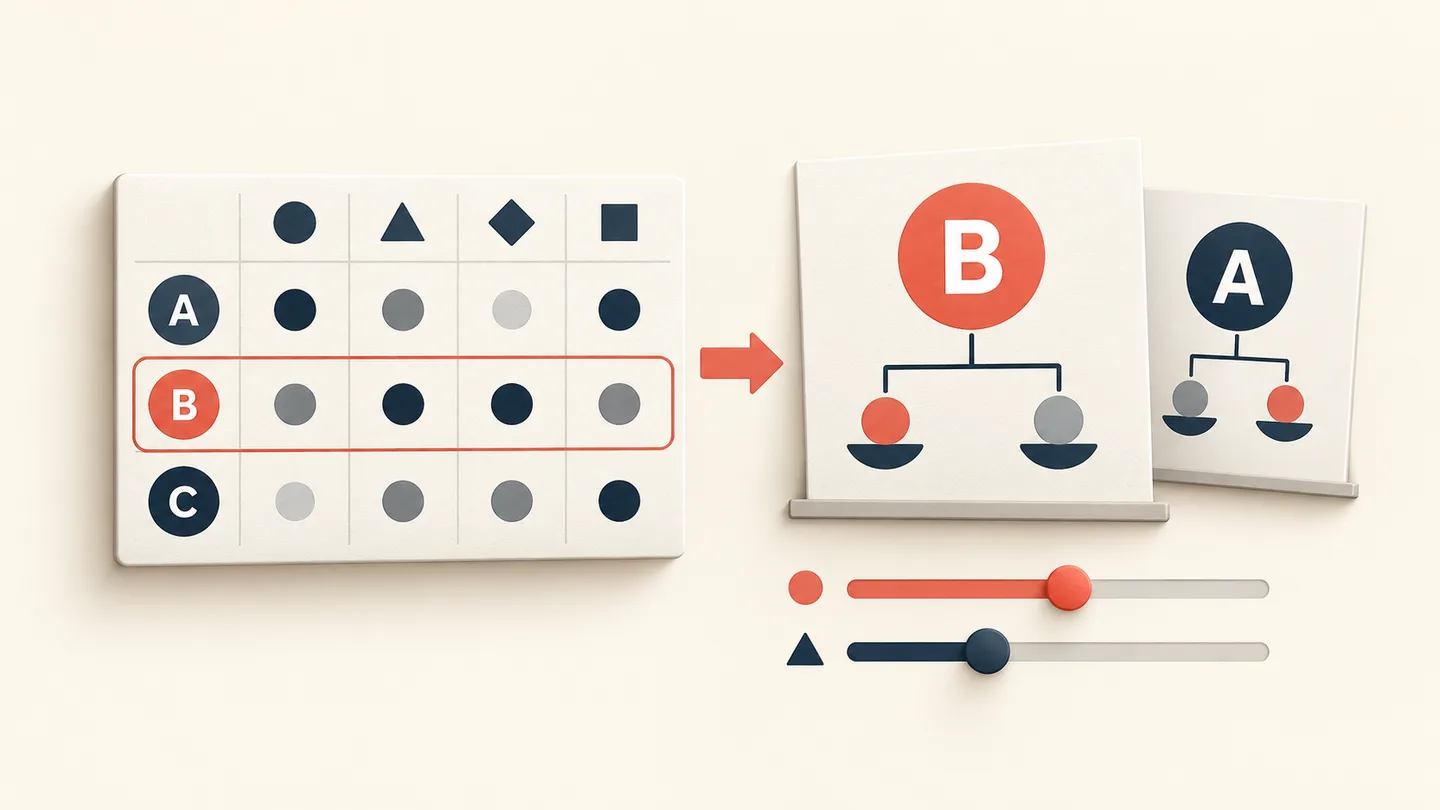
To explain a technical project to a nontechnical audience, begin with the consequence they need to understand, then show enough of the mechanism to make the evidence and trade-offs meaningful. Replacing technical words with shorter words helps only if the reasoning becomes easier to follow.
Your colleagues may know the customer, the operating process or the budget in much greater depth than you do. What they may lack is the specialist context behind an architecture diagram. Build that context deliberately, without removing the uncertainty they need to judge the proposal.
Start with the question your audience must answer
Write down the specific roles in the room and the action you need from them. A support leader may need to explain changed behavior to customers. A product manager may need to choose the scope of a pilot. A finance colleague may need to understand the resource commitment. Those questions require different detail from a code review.
For the worked example in this guide, an engineering team wants permission to pilot a new way of generating reports. The audience includes product, operations and support. They need to understand what users will see, what could go wrong and what evidence is required before a wider rollout.
The MIT EECS Communication Lab's slide guidance recommends shaping the explanation around audience knowledge, introducing unfamiliar figures and giving each slide a clear message. Apply that by deciding which part of the mechanism the audience needs before showing the complete architecture.
Before and after: explain a queued-reporting proposal
This is an authored communication example. The proposed system and practice data below illustrate a slide rewrite; they are not results from a customer or a live product test.
The initial slide is titled “Asynchronous orchestration with durable queues and idempotent workers.” Its diagram contains an API gateway, a queue, worker processes, a database, retry arrows and monitoring components. An engineer may recognize the pattern. Other colleagues still need to know what changes for a person requesting a report.
Rewrite the headline as: “Users can leave the report page while the report is being prepared.” Beneath it, show the proposed sequence:
- The user requests a report.
- The application acknowledges the request and records a pending job.
- A background process prepares the report.
- The application shows the completed result or a clear failure status.
Add the crucial distinction beside the diagram: Request accepted does not mean report ready. A short acknowledgment may change the waiting experience, but it does not by itself prove that the calculation finishes sooner.
Microsoft's queue-based load-leveling guidance describes how a queue separates incoming work from processing. It also notes that a queue grows when work keeps arriving faster than it can be processed. For this presentation, that becomes a plain question: “What will users see if the backlog grows?”
Keep the technical terms that the decision actually needs
Some terms deserve a definition; others can remain in the engineering appendix. Explain a necessary term once in context, then use the same wording throughout.
| Technical term | Audience-facing explanation | Question it helps answer |
|---|---|---|
| Queue | A place where pending report jobs wait to be processed. | What happens when many people request reports at once? |
| Worker | The background process that creates the report. | What keeps doing the work after the user leaves the page? |
| Retry | Another attempt after a job fails or is interrupted. | How will a failed request recover, and when will someone intervene? |
| Idempotent processing | Handling the same job again without producing an unintended duplicate outcome. | What prevents a retry from creating duplicate records or actions? |
The table does not establish that the proposed system already handles those cases correctly. It identifies what the engineering team must explain or test. Keep the actual failure handling, implementation choices and test evidence in supporting material.
An analogy can provide an entry point: a queue is like a line of tickets waiting to be handled. State where it stops helping. In a real system, multiple workers and retries may affect processing order, so a simple first-in, first-out picture may imply behavior the design does not provide.
Make the evidence understandable without making it stronger
Use this small dataset as a slide-writing exercise: of 100 report requests, 90 finish within 60 seconds and 10 take longer. Suppose the proposal sets a target of 95% within 60 seconds. These are illustrative inputs, not measured results from a system reviewed for this article.
| What the example says | What you can conclude |
|---|---|
| 90 of 100 requests finish within 60 seconds. | The share within that interval is 90%. |
| The illustrative target is 95% within 60 seconds. | The sample is below the target; showing a fast acknowledgment would not resolve that gap. |
| No comparison with the current system is supplied. | The example does not establish a performance improvement. |
| No breakdown of the ten slower requests is supplied. | The cause of their delay remains a question, not a finding. |
A weak slide says “The new architecture makes reports fast.” A more useful title says “The practice sample misses the proposed completion-time target.” Show the denominator and threshold beside the visual, and explain which additional evidence would change the decision.
For a real proposal, label when timing starts and stops, the workload, the number of requests and whether failures are included. Separate observed results from forecasts and target values. If the slide compares the old and proposed system, use comparable conditions or explain the differences. The data storytelling guide develops that evidence-to-action path in more detail.
A six-slide briefing that preserves the engineering question
Here is a copyable narrative for the reporting example. Replace the illustrative details with reviewed project evidence before using it at work.
Slide 1: Explain the current user experience
Title: “Report creation keeps users waiting on the page.”
Spoken explanation: “Our current flow asks the user to remain here until the report is prepared. We are evaluating a flow that acknowledges the request and makes the result available afterward.” Show the current steps, and avoid adding a failure rate you have not measured.
Slide 2: Show what would change
Title: “The proposed flow separates requesting a report from receiving it.”
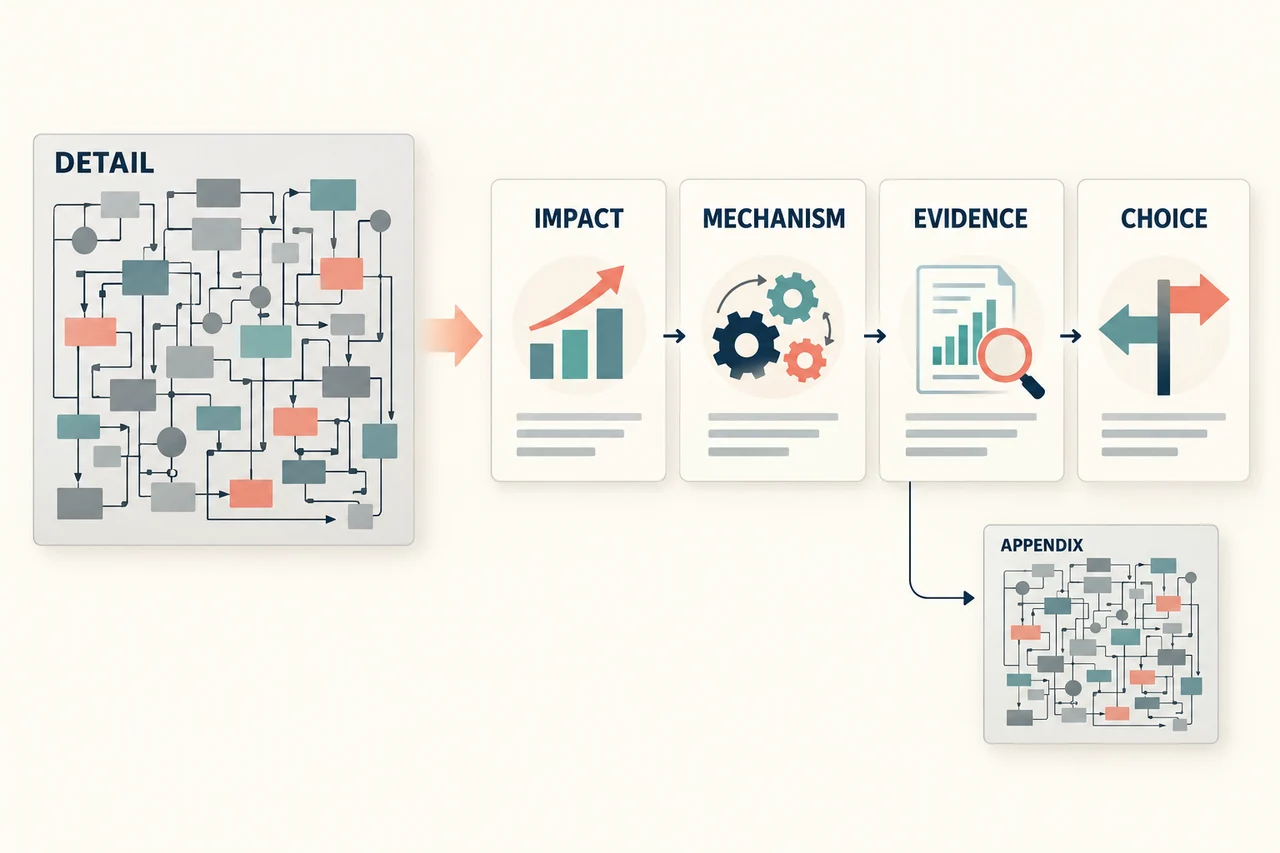
Spoken explanation: “The application records the request, a background process creates the report, and the user sees its status. Acknowledgment and completion are separate events.” Use the four-step diagram instead of the full deployment map.
Slide 3: Explain what is known
Title for the practice data: “90% finish within 60 seconds, below the proposed 95% target.”
Spoken explanation: “This illustrative sample has 100 requests. Ten take longer than the threshold. We need representative measurements and a current-system baseline before claiming improvement.” In a real briefing, replace this exercise with the actual evidence and its limitations.
Slide 4: Make the new responsibility visible
Title: “The new flow needs clear status and recovery behavior.”
Spoken explanation: “Users need to know whether a report is pending, complete or failed. Support needs a way to distinguish a slow job from one requiring intervention. The design must also handle retries without unintended duplicate outcomes.” Link to the specific design and test questions in the appendix. If you are explaining a failure that has already happened, the incident postmortem example separates the recovery timeline, affected work and evidence still needed about the cause.
Slide 5: Propose a bounded next step
Title: “A limited pilot can test the waiting experience and recovery path.”
Spoken explanation: “Agree on the pilot participants, entry conditions, measurements, stop conditions and accountable owner before it begins. Measure completion and failures as well as acknowledgment.” Leave values blank until the responsible people agree them.
Slide 6: Ask for the decision you are ready to support
Title: “Decide whether to proceed with the pilot and who owns the review.”
Spoken explanation: “We are asking for the scoped pilot, with a review of the agreed evidence before wider rollout.” If unresolved design work prevents even that step, ask for the smaller action needed to resolve it.
Keep an appendix that can answer the next question
The simplified main path should lead to supporting detail, not make it disappear. Give the appendix stable labels: architecture and dependencies; measurement definitions; test conditions; failure/retry behavior; alternatives considered; and rollout or rollback ownership. Refer to the relevant page from the main slide.
Prepare for questions that expose the key distinction. If someone asks, “Will reports now be instant?”, answer the two parts: the proposal changes request acknowledgment, while report completion still depends on processing and workload. If someone asks, “What happens during a backlog?”, show the status and recovery plan—or state what the team still needs to design.
Try the explanation with a colleague from the intended audience. Ask them to describe what changes for the user and what decision you are requesting. If they remember only “a faster system,” the distinction between acknowledgment and completion needs to be clearer.
Prepare the brief before asking for a slide draft
The technical explanation brief and six-slide narrative are available as a copyable text resource, including the illustrative data and the distinctions to preserve.
Gather the audience, user consequence, short mechanism, necessary definitions, reviewed evidence, uncertainty and requested decision. You can use that text in Presenti to propose an outline and slide draft. Keep the technical owner involved when shortening explanations; a smoother sentence can still remove an important condition.
Explain [project] to [audience and roles].
They need to understand or decide: [task].
Use only the supplied mechanism and evidence.
Organize six slides around consequence, mechanism, evidence, trade-off, next step and decision.
Define the unfamiliar terms that the decision requires.
Preserve units, denominators, uncertainty and limitations.
Flag missing evidence rather than inventing it.
Keep detailed implementation material in a referenced appendix.
The best sign that the explanation is working is a more specific conversation: which condition is unresolved, which trade-off is acceptable, and which evidence is needed next. Those questions give both the technical team and its colleagues a useful way forward.