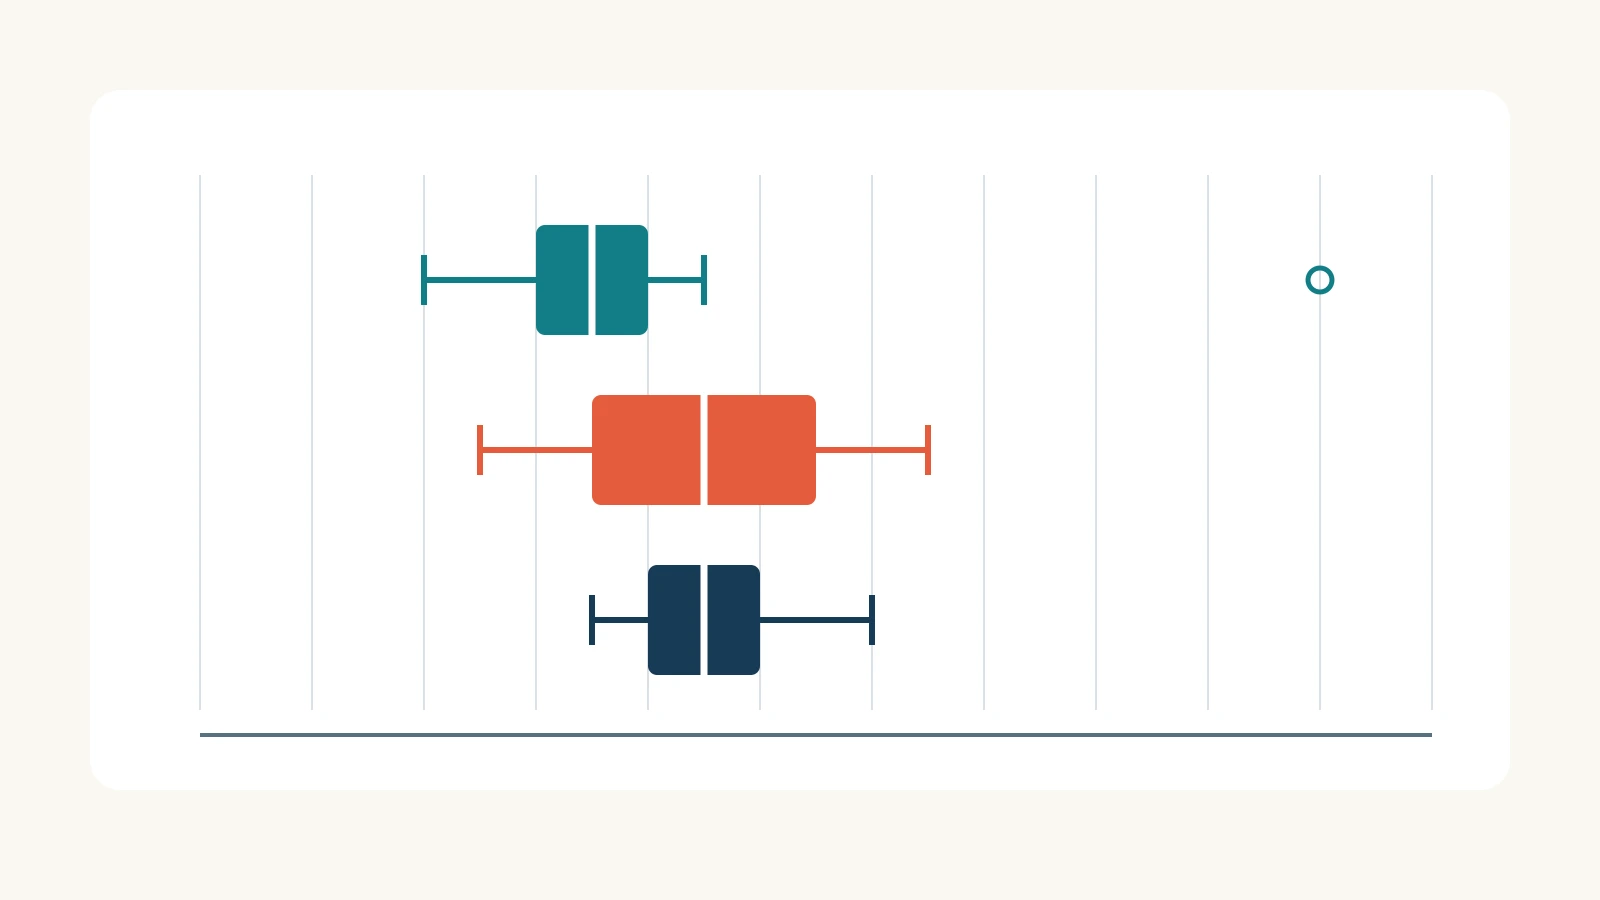
A box plot helps an audience compare the center and spread of numerical observations across groups. The line inside each box marks the median, the box spans the lower and upper quartiles, and the whiskers follow a stated rule. In the example below, unusual observations appear separately instead of stretching a whisker to the largest value.
Use this format when “Which group has the higher average?” is too simple a question. Two groups can have the same median and different spreads; a group with a lower median can still include a very long case. A useful slide makes those differences visible without declaring a winner that the data cannot establish.
If you are still choosing a chart for your presentation, a box plot is most useful for comparing distributions on the same numerical scale. For a tiny dataset, retain the individual points as well. They show what the compact boxes leave out.
Read the box before writing the headline
The NIST box-plot guide describes both minimum-to-maximum whiskers and a version using fences to identify unusual observations. The example here uses the latter: calculate the interquartile range, or IQR, as Q3 minus Q1; set fences at Q1 − 1.5 × IQR and Q3 + 1.5 × IQR. Whiskers end at the smallest and largest observed values within those fences. Values outside them remain separate points.
That convention matters when explaining the chart. The upper whisker is not necessarily the maximum. A fence is a calculated threshold, not another observation or the end of a whisker. State the convention near the graphic so a reader does not have to guess what its lines mean.
Start with three comparable groups
Consider a fictional packing operation with three stations. The table contains ten completed orders per station, measured in minutes from the start of packing to completion. These values illustrate the chart; they are not a Presenti customer result or a measured product benchmark.
| Station | Sorted packing times, in minutes | Orders |
|---|---|---|
| A | 4, 5, 6, 6, 7, 7, 8, 8, 9, 20 | 10 |
| B | 5, 6, 7, 8, 9, 9, 10, 11, 12, 13 | 10 |
| C | 7, 8, 8, 9, 9, 9, 10, 10, 11, 12 | 10 |
All three groups use the same unit and start/end definition. That makes the numbers readable together, but it does not establish equal workloads: the example does not specify the items, order complexity or staffing conditions. It also says nothing about orders that were still unfinished. A real comparison needs that context before it can support an operational recommendation.
Keep one row per order in the underlying data. Averaging each station first would leave only three numbers and destroy the within-station variation the box plot is meant to explain.
Calculate one box from the values
For this worked example, use the median of the lower half and median of the upper half to calculate quartiles. Each group has ten sorted values. The overall median is the average of positions five and six; Q1 is the median of positions one through five, and Q3 is the median of positions six through ten. Use this same rule for all three groups.
Station A makes the calculation easy to follow. Positions five and six are both 7, so the median is 7. The lower five values are 4, 5, 6, 6, 7: their median is 6. The upper five are 7, 8, 8, 9, 20: their median is 8. Therefore, IQR = 8 − 6 = 2 minutes.
The lower fence is 6 − 1.5 × 2 = 3; the upper fence is 8 + 1.5 × 2 = 11. A has no observations at 3 or 11. Its smallest value within the fences is 4 and its largest is 9, so those are the whisker endpoints. The 20-minute order appears as a separate point.
| Measure | Station A | Station B | Station C |
|---|---|---|---|
| Q1 | 6 | 7 | 8 |
| Median | 7 | 9 | 9 |
| Q3 | 8 | 11 | 10 |
| IQR | 2 | 4 | 2 |
| Lower / upper fences | 3 / 11 | 1 / 17 | 5 / 13 |
| Lower / upper whiskers | 4 / 9 | 5 / 13 | 7 / 12 |
| Points beyond the fences | 20 | None | None |
Every value in the table is in minutes. Your spreadsheet or charting package may use a different quartile convention and return different box edges, especially with small samples. Check the setting and keep it consistent; do not manually move a box edge to match a diagram calculated another way. Preserve the raw values and the selected convention with the chart.
Put all three boxes on one scale
A horizontal arrangement works well here: one row for each station and a shared time axis from 0 to 22 minutes. Give the boxes the same height. Write “n = 10” beside each station rather than making the viewer infer sample size from the shape.
Draw the median line distinctly inside each box and the whisker caps at their actual endpoints. Show the 20-minute observation without cutting off the axis. With only ten orders per station, small individual points above or below the box can preserve the original observations. When values repeat, offset the points vertically while keeping their horizontal positions exact.
Use direct labels and restrained color. A bright red point can imply an error or failure; here, the point only meets the chosen statistical flagging rule. If one comparison is the subject of the talk, emphasize that pair and keep the third station legible as context.
Below the chart, include a compact note: “Illustrative completed orders; n = 10 per station. Quartiles: medians of the two halves. Whiskers: observed values within 1.5 × IQR fences.” The detailed arithmetic belongs in the accompanying table or notes, not across the plot.

Choose the comparison your slide answers
For a discussion of typical packing time, the headline could be: “A has the lowest median, with one 20-minute order.” The audience can see both parts: A's median is 7 minutes compared with 9 for B and C, while its longest observation is still visible. “A is the fastest station” would hide the variation and imply a broader judgment than these orders support.
For a discussion of consistency, use a different headline: “B and C share a median; B's middle spread is wider.” Their medians are both 9, but B's box runs from 7 to 11 while C's runs from 8 to 10. Explain those endpoints aloud rather than simply calling one box “better.”
Do not treat overlapping boxes as a significance test, or nonoverlapping boxes as proof of one. These are descriptive observations from a small example. The graphic does not establish that a station caused a difference, that future orders will follow the same pattern, or that a staffing change would improve performance.
A box plot also hides some detail about shape. If the question concerns clusters or gaps in a larger set of observations, a histogram showing the frequency distribution may be more informative. Choose the graphic that answers the question instead of adding several chart types to the same slide.
Investigate a flagged point without erasing it
For A's 20-minute order, return to the record: are the unit and timestamps correct, does it belong to the stated packing interval, and was there a documented interruption? The chart alone cannot answer those questions. A correctly recorded complex order is different from a timestamp entered in the wrong unit.
If the record is valid, keep it. If a source error is confirmed, correct the underlying data and recalculate the whole chart. If you need a separate view of a narrower order type, label that selection and retain the broader view for context. Removing the longest order simply because the slide looks cleaner changes the question without telling the audience.
Turn the comparison into a slide brief
Prepare one chart, one supported headline and the information needed to read it. A usable brief for this example is:
Compare packing times for three fictional stations, with ten completed orders each. Show horizontal box plots on a shared 0–22-minute axis using the supplied raw data and calculated quartiles. Use median-of-halves quartiles and whiskers to observed values within 1.5 × IQR fences. Keep A's 20-minute order visible. Lead with “B and C share a median; B's middle spread is wider.” Include the sample sizes and measurement definition. Do not claim significance, causation or a productivity ranking.
Use your checked chart and brief when preparing a presentation draft in Presenti, then edit the headline and surrounding explanation. Verify any inserted chart against the calculated values; slide drafting does not establish the statistics. The finished slide should let a listener identify the median, explain the box's spread and recognize what the separate point does—and does not—tell them.