A break-even analysis slide should answer a concrete question: how many units must you sell in a stated period for revenue to cover the costs included in your model? Put that threshold in the headline, show the price and cost assumptions beside it, and use a chart to explain what changes on either side of the crossing.
For an investor presentation, this belongs in the financial explanation of your pitch deck. It does not replace a cash forecast or prove that customers will buy the required volume. The useful result is a threshold the audience can challenge, together with the assumptions that would move it.
Start with a unit, a period and a cost boundary
Consider a fictional business selling a standard training workshop. One unit is one delivered workshop, not one attendee or one booked enquiry. The analysis covers one month. Its modeled fixed costs are $12,000 per month, its selling price is $600 per workshop, and delivery costs that vary with each workshop are $200.
The model therefore leaves $400 per workshop to cover fixed costs. At 30 workshops, revenue and modeled total cost are both $18,000. That is the claim the slide can make. It cannot yet say the company will break even in its third month, recover its initial investment, or have $18,000 in the bank.
The SBA's break-even guidance defines the threshold by equal revenue and cost and gives the single-product formula: fixed costs divided by price per unit minus variable cost per unit. Use compatible units and the same period for the inputs. This article's workshop figures are an illustrative example, not observed business results.
| Input | Workshop example | What to make explicit |
|---|---|---|
| Unit | One delivered workshop | Whether the unit is a sale, order, seat or service engagement |
| Period | One month | The period used for fixed costs and expected volume |
| Price per unit | $600 | The assumed amount earned per unit, with a consistent treatment of discounts and taxes |
| Variable cost per unit | $200 | Costs that change with one additional unit within the modeled range |
| Fixed costs | $12,000 per month | Which costs are included, and the volume range over which they stay fixed |
Calculate the crossing before drawing it
For this example, the arithmetic is $12,000 ÷ ($600 − $200) = 30 workshops. Each completed workshop contributes $400 toward the $12,000 monthly fixed amount. The following rows are enough to construct and check the two lines.
| Workshops in the month | Revenue | Total modeled cost | Revenue minus cost |
|---|---|---|---|
| 0 | $0 | $12,000 | −$12,000 |
| 10 | $6,000 | $14,000 | −$8,000 |
| 20 | $12,000 | $16,000 | −$4,000 |
| 30 | $18,000 | $18,000 | $0 |
| 40 | $24,000 | $20,000 | $4,000 |
If the calculation produces a fraction and your unit cannot be sold fractionally, round the operational threshold up. A result of 30.4 workshops requires 31 whole workshops under those assumptions. Keep the unrounded number in the supporting calculation so the audience can reproduce the result.
A price no higher than the variable cost gives no positive contribution per unit. In that case, drawing the lines farther to the right will not produce a meaningful positive-volume break-even point for a model with positive fixed costs. Revisit the assumptions rather than displaying a negative or infinite sales target.

Build a chart that makes the threshold readable
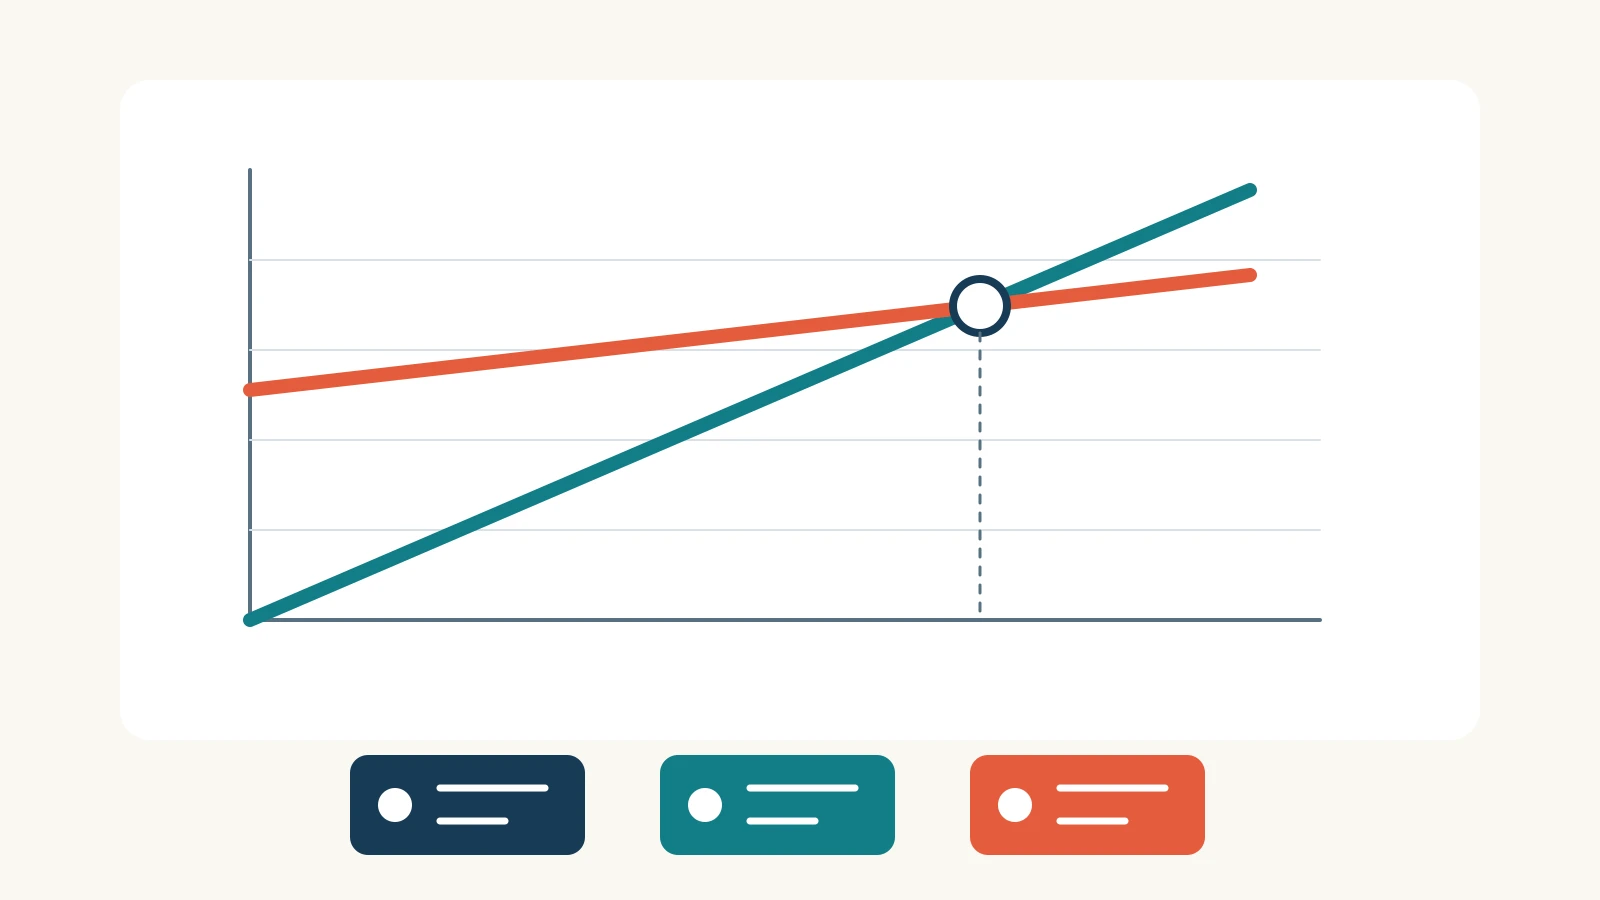
Use workshops per month on the horizontal axis and dollars per month on the vertical axis. Start revenue at zero. Start total cost at $12,000. Both lines rise, but revenue rises faster in this example. Mark their intersection at 30 workshops and $18,000, and label the lines directly near their ends.
The total-cost line is essential. A horizontal fixed-cost line alone would cross revenue at 20 workshops and suggest the wrong answer: it leaves out $4,000 of delivery costs at that volume. You can show fixed costs as a secondary reference, but do not let that extra line compete with the two lines that determine the threshold.
For a small slide, show a few clear axis ticks rather than every possible workshop count. Put the formula in a short supporting line. Do not use a second vertical scale, a decorative upward arrow, or an unlabeled shaded area to imply profit growth. If the chart extends beyond practical capacity, state that boundary where the audience can see it.
Write the slide around the result and its condition
A useful headline for the example is 30 workshops per month cover the modeled monthly costs. Under it, a brief qualifier can read: “At $600 per workshop, $200 variable delivery cost and $12,000 monthly fixed costs.” This lets the audience understand the result before reading the formula.
Place the chart across most of the slide. Use one small assumptions panel and one decision note, such as “Compare the 30-workshop threshold with qualified demand and delivery capacity.” Keep detailed expense categories in the supporting workbook or appendix. They should be available, but they do not all need to compete for attention on the main slide.
Avoid “We become profitable at 30 sales” unless the unit and included costs justify that wording. “Modeled monthly costs” is more precise when the analysis excludes startup investment or other cash movements. Explain meaningful exclusions in the assumptions panel, not in tiny text that nobody can read.
Show which assumption moves the threshold
A single crossing can look more certain than its inputs. Add a small sensitivity table when a decision depends on pricing or costs. Change one input at a time so the audience can see why the threshold moved.
| Scenario | Contribution per workshop | Whole workshops needed |
|---|---|---|
| Base: price $600, variable cost $200, fixed cost $12,000 | $400 | 30 |
| Price falls to $550; other inputs unchanged | $350 | 35 |
| Variable cost rises to $250; other inputs unchanged | $350 | 35 |
| Fixed cost rises to $14,000; other inputs unchanged | $400 | 35 |
The same threshold can arise from different causes. A price concession and a delivery-cost increase both lead to 35 whole workshops here, but call for different business decisions. Use specific scenario labels rather than “bad,” “normal” and “good,” which hide what changed.
These scenarios are arithmetic alternatives, not probability estimates. Do not assign likelihoods or present a “most likely” case without evidence. If several inputs change together in a real proposal, show that combined scenario separately instead of suggesting that a one-variable comparison represents it.
Keep volume, time and cash questions separate
The horizontal axis in this slide measures workshops, not months. Converting 30 workshops into a date requires a time-based sales and delivery plan. Comparing the threshold with a target of 40 workshops does not establish that 40 are achievable.
Payment timing also matters. If customers pay after delivery while suppliers require payment earlier, a month that covers modeled costs can still require cash. Similarly, a recurring monthly break-even calculation does not tell you when an initial investment will be recovered. Use separate supporting schedules for those questions.
The straight lines assume the price, variable unit cost and fixed-cost amount apply throughout the displayed range. Suppose a second trainer is required above 24 workshops and adds a fixed monthly commitment. The original straight cost line no longer describes that range. Recalculate the cost schedule before calling 30 workshops attainable under the same conditions.
With several products or service packages, the sales mix also matters. Do not divide all fixed costs by the margin of the highest-priced package while showing combined unit sales. Either keep the slide explicitly about one product or use a defined mix and explain the model behind it.
Turn the calculation into an editable presentation draft
Bring the checked model into Presenti as source material. A useful brief names the audience, decision, unit, period, three cost inputs and exact chart values. Ask for a financial explanation, then compare every number and axis label in the draft with the calculation.
Create a three-slide explanation for a fictional workshop business: assumptions, monthly break-even chart and sensitivity. One unit is one delivered workshop. Monthly fixed costs are $12,000, price is $600 per workshop and variable cost is $200. Base break-even is 30 workshops at $18,000 revenue and cost. Use volumes 0, 10, 20, 30 and 40 with the supplied revenue and cost table. Explain that this is a volume threshold, not a date or payback forecast. Keep the lower-price, higher-variable-cost and higher-fixed-cost scenarios separate. Do not invent demand, probabilities or customer results.
After exporting a PPTX, check that the chart still communicates the same values and that the assumptions remain readable. The broader business model slide can explain who pays and for what; this slide should stay focused on how the stated unit economics cover the stated costs.
Close with the decision the evidence supports: validate the price, reduce a specified cost, check demand against the threshold, or revise the operating model. The chart is useful because it shows what must be true, not because two lines happen to cross.