A capacity planning presentation should answer three questions: what work is coming, which capability is short, and what decision would close the gap? Start with the constraint. A team can have spare hours overall and still miss its deadline because the people qualified to do one step are fully booked.
Build the deck from a small, checked workload model. Once the numbers and assumptions are agreed, use Presenti’s text-to-presentation workflow to turn the explanation into an editable draft. The model should drive the slides; a generated narrative should not decide how much work the team can deliver.

State the planning period and the decision
“We need more people” is too broad to approve. “For the next four weeks, qualified review work exceeds available review time by 20 hours” gives the audience something to resolve. Include the date range, work already committed, service expectations, and the person who can change scope or allocate help.
Use the same period for demand and capacity. A monthly demand forecast cannot be compared directly with one week of available time. Say whether the forecast includes the opening backlog and whether unfinished work is allowed to carry into the next period. Otherwise, apparently balanced numbers may hide a growing queue.
The Open University’s capacity and demand management course emphasizes using demand information to plan resources. The illustrative service-team example below applies that principle; its estimates are invented for explanation, not industry benchmarks.
Convert work into hours by skill
Suppose an implementation team expects 40 standard requests and 10 complex requests over four weeks. Assume there is no opening backlog and all 50 requests are due within this period. A standard request needs two analyst hours and half an hour of qualified review. A complex request needs six analyst hours and two review hours. These are separate work steps, not interchangeable effort.
| Work type | Requests | Analyst time | Review time |
|---|---|---|---|
| Standard | 40 | 40 × 2 = 80 hours | 40 × 0.5 = 20 hours |
| Complex | 10 | 10 × 6 = 60 hours | 10 × 2 = 20 hours |
| Total | 50 | 140 hours | 40 hours |
Show the arithmetic beside the chart, or keep it in the appendix with a visible reference. A single “180 hours required” bar is correct but insufficient: it hides the 40-hour requirement for a specific capability. If one person performs both steps, allocate their time once. Counting the same person’s hours in both pools would overstate available capacity.
Effort estimates should have an owner and a basis, such as recent comparable requests. Record whether waiting, rework, and meetings are included. A time estimate based only on smooth requests will make a volatile queue look easier than it is.
Subtract known commitments before showing availability
In this example, the analysts have 240 scheduled hours. Planned leave removes 24 hours, and support duties, meetings, and other assigned work remove 56. That leaves 160 analyst hours. The reviewer has 60 scheduled hours, of which 40 are already committed elsewhere, leaving 20 review hours.
| Capability | Required | Available | Balance |
|---|---|---|---|
| Analysis | 140 hours | 160 hours | 20 hours spare |
| Qualified review | 40 hours | 20 hours | 20 hours short |
| Combined | 180 hours | 180 hours | Zero overall |
The combined row balances, but the plan does not. Analysts cannot automatically substitute for an authorized reviewer. Lead with a two-row chart showing each capability, then explain the constraint: “Total hours match demand; review capacity covers only half of the required review work.”
Do not apply a universal utilization percentage simply to make the model look prudent. If you reserve time for interruptions, identify the reason and avoid subtracting interruptions already included in the effort estimates. Keep known commitments separate from an explicit contingency allowance.
Compare options that change the actual bottleneck
Every option needs a mechanism, a dependency, and a consequence. Adding an analyst would not fix this example’s review shortage. These alternatives would address it, although none is automatically preferable:
| Option | Effect in this example | What must be agreed |
|---|---|---|
| Borrow qualified review support | 20 additional review hours would close the modeled gap | Availability, authority, access, and any handover time |
| Defer five complex requests and twenty standard requests | Removes 20 review hours and 70 analyst hours from this period | Customer impact, priority rules, and capacity in the later period |
| Cross-train an analyst | Could add future review capability; current-period benefit is unconfirmed | Training effort, assessment, authorization, and the effect on analyst capacity |
The first option is only viable if the borrowed time is productive review time. If a reviewer needs four hours of setup within a 20-hour allocation, the net addition is 16 hours and four hours remain uncovered. Show that adjustment before asking for approval.
The second option moves work; it does not remove demand. Add the deferred work to the next period’s opening backlog. This is why a deck that shows only this month’s green status can lead to a poor decision about next month.
Test the assumption most likely to change the answer
Run one useful sensitivity case instead of decorating the slides with three arbitrary scenarios. If complex requests require three review hours rather than two, total review demand becomes 20 + 30 = 50 hours. The gap rises from 20 to 30 hours. Borrowing 20 hours would then leave 10 hours unresolved.
Also check timing within the four weeks. Forty review hours available only in the last week cannot support requests due earlier. A short weekly view should place incoming work, deadlines, and qualified availability on the same timeline. Escalate a timing mismatch even when the monthly totals balance.
For a variable process, describe the estimate as a planning assumption. Record the observation that would trigger a revision—for example, the first completed complex requests taking materially longer than assumed. Do not present a precise point estimate as a guaranteed completion date.
Use six slides to reach a decision
- Decision: the review shortfall, period, and requested action.
- Demand: work types, opening backlog, quantities, and deadlines.
- Workload: quantity × effort for each required capability.
- Availability: scheduled time minus known commitments, with no double counting.
- Options: net capacity added or work moved, plus dependencies and consequences.
- Agreement: who authorizes the option, what remains uncertain, and when the plan will be revisited.
A longer operations plan presentation can hold the workstreams and delivery roadmap. Keep this deck focused on the capacity decision rather than reproducing that entire plan.
Prepare a brief the slide draft can follow
Paste a compact brief into Presenti’s Paste Text input after checking the calculations. Include both capability rows; otherwise, the draft may emphasize the misleading combined total. Keep confidential staff details out of the example.
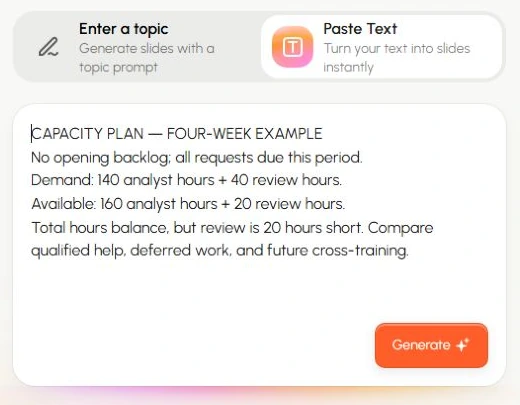
Create a six-slide capacity planning draft for a service team. Illustrative four-week case: 40 standard requests at 2 analyst hours and 0.5 review hours each; 10 complex requests at 6 analyst hours and 2 review hours each. Available: 160 analyst hours and 20 qualified review hours. Explain the 20-hour review shortfall despite balanced total hours. Compare borrowed qualified review time, explicitly deferred requests, and future cross-training. Preserve assumptions and do not invent approval, staffing costs, or a guaranteed deadline.
After drafting, read every chart label and option aloud against the model. The most important sentence is the one your audience must act on: a specific capability is short, a feasible response exists, and a named owner can authorize it.