An operational plan template should explain how a team will execute a strategy within a defined period. It connects objectives to deliverables, workstreams, owners, resources, dependencies, risks, milestones, and performance measures. The audience should leave knowing what will happen, who is accountable, what could block delivery, and when leaders must make the next decision.
This template fits a department plan, cross-functional initiative, quarterly operating review, or implementation proposal. It is not a complete standard operating procedure and it should not reproduce every task from a project-management system. The deck is the decision layer: it aligns the work, tests feasibility, and makes exceptions visible.
What Is an Operations Plan Presentation?
Strategic planning defines the direction; operational planning translates that direction into nearer-term work. For a presentation, that means narrowing the scope to one team, program, location, product, or operating cycle and stating what result must be delivered during the planning window.
Open with an answer rather than a definition. For example: "To reduce customer onboarding time from 18 to 12 days next quarter, standardize the handoff, automate two verification steps, and add a weekly exception review led by operations." The statement identifies the outcome, baseline, proposed changes, period, and owner.
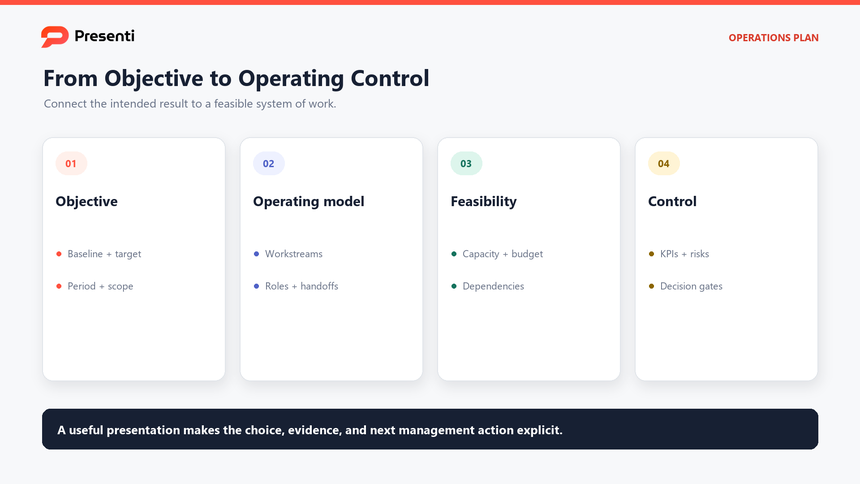
| Layer | Question | Presentation evidence |
|---|---|---|
| Objective | What outcome must change? | Baseline, target, period, and strategic link |
| Operating model | How will the work produce the outcome? | Workstreams, process, roles, and handoffs |
| Feasibility | Can the team execute the plan? | Capacity, budget, dependencies, and assumptions |
| Control | How will leaders detect and respond to variance? | KPIs, milestones, thresholds, risks, and escalation |
Keep the planning horizon explicit. A quarter may be right for a fast-changing team, while a six-month or annual window may fit stable operations. Match the level of detail to the period. A weekly task list does not belong on the executive slide, but a milestone that controls the outcome does.
Which Slides Belong in an Operations Plan Deck?
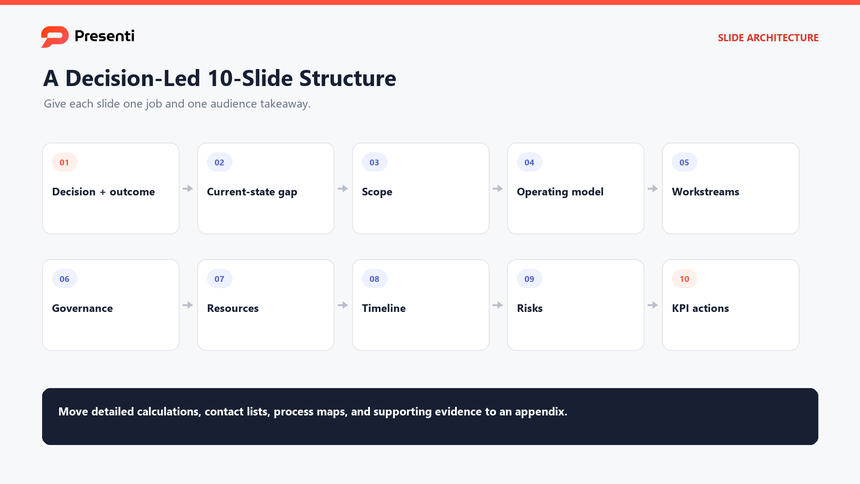
A concise operations plan typically uses ten core slides. Combine slides when the initiative is simple; use an appendix for process detail, cost calculations, role matrices, and supporting data.
An operational planning presentation should keep the timeline, dependencies, and decision gates visible rather than hiding them in a task list.
- Decision and operating outcome. State the result, planning period, and approval or support required.
- Current state and performance gap. Show the baseline, customer or business impact, and evidence behind the priority.
- Scope and boundaries. Define what the plan includes, excludes, and assumes.
- Operating model. Show how work, information, and decisions move through the system.
- Workstreams and deliverables. Group the work into a small number of outcome-linked streams.
- Owners and governance. Name accountable owners, decision rights, handoffs, and review cadence.
- Resources and capacity. Explain people, tools, budget, facilities, suppliers, or data needed.
- Timeline and dependencies. Show milestones, sequencing, critical dependencies, and decision gates.
- Risks and contingencies. Prioritize material risks, triggers, mitigations, and escalation owners.
- KPI scorecard and next actions. Define leading and lagging measures, thresholds, and immediate commitments.
Each slide needs a verb. "Resources" is a topic; "Add two implementation specialists before the April migration wave" is an operational conclusion. This discipline helps the audience distinguish information from action.
Use the executive summary slide framework when the plan must be reduced to a one-page decision view. Keep the detailed workstreams and evidence in the main deck or appendix.
How Do You Translate Strategy into Workstreams?
Begin with the outcome and work backward. Ask which observable changes must be true for the objective to be achieved, then group related changes into three to five workstreams. A workstream should produce a deliverable or operating capability, not merely describe a department.
For an onboarding-time example, useful workstreams might be "intake quality," "verification automation," "implementation capacity," and "exception governance." A department-based list such as sales, support, IT, and operations hides the shared outcome and encourages each team to present a separate task list.
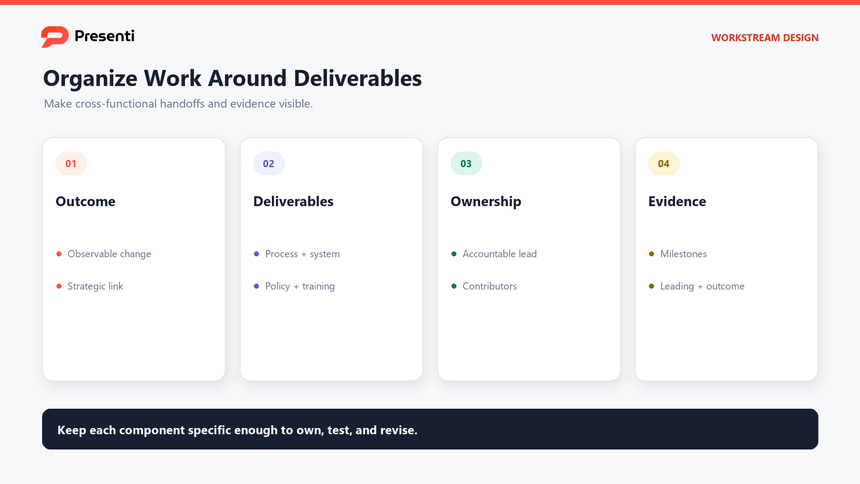
Describe every workstream with the same fields:
- Outcome: the operational change the workstream must create.
- Deliverables: the tangible process, system, policy, training, or data change.
- Owner: one accountable person, with contributors named separately.
- Milestones: evidence that the work is progressing, not percentages without definitions.
- Dependencies: inputs, approvals, vendors, or upstream work that control timing.
- Measure: the leading indicator and business outcome connected to the stream.
Show handoffs where work crosses teams. A swimlane, dependency map, or simple input-output chain is often more useful than a dense Gantt chart. Keep individual tasks in the execution system and present only the milestones or exceptions that change the plan.
How Should You Present Resources, Risks, and Dependencies?
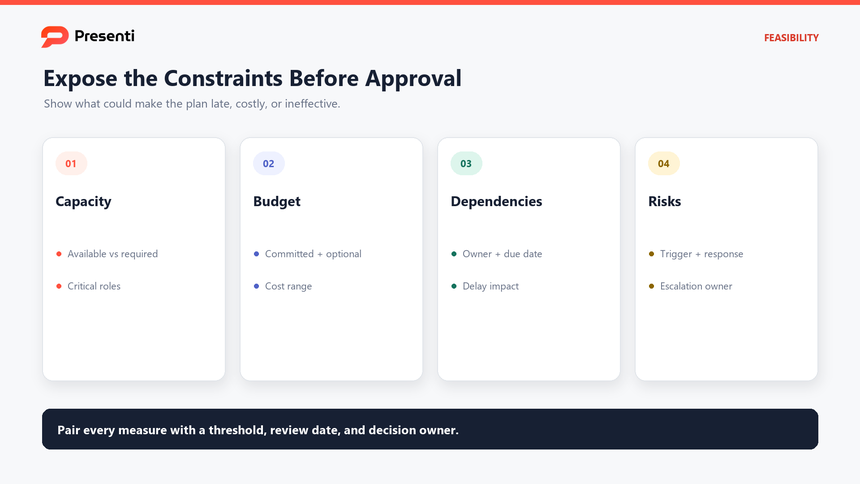
Plans often fail at the interfaces between workstreams. Put the most important dependencies, capacity limits, and decision gates on the main slides. Leaders do not need every task, but they do need to see which assumption could make the plan impossible.
| Constraint | What to show | Useful decision |
|---|---|---|
| Capacity | Available versus required effort by critical role or period | Add capacity, reduce scope, or move timing |
| Budget | Major cost drivers, range, timing, and approval status | Fund, phase, replace, or stop work |
| Dependency | Upstream deliverable, owner, due date, and impact of delay | Escalate, resequence, or create a fallback |
| Risk | Trigger, likelihood, impact, mitigation, and escalation owner | Accept, reduce, transfer, or avoid exposure |
A risk statement should be causal: "If the data migration test is not complete by May 10, regional training cannot begin, delaying the launch by at least two weeks." Pair it with a trigger and a response. A generic red box labeled "technology risk" provides no management value.
Use ranges when precision is false. Capacity and cost may depend on adoption, volume, or supplier lead time. Show the base assumption and the threshold that forces a different plan. Keep contingency resources distinct from committed resources so the audience does not count the same capacity twice.
What Does a 90-Day Operations Plan Example Look Like?
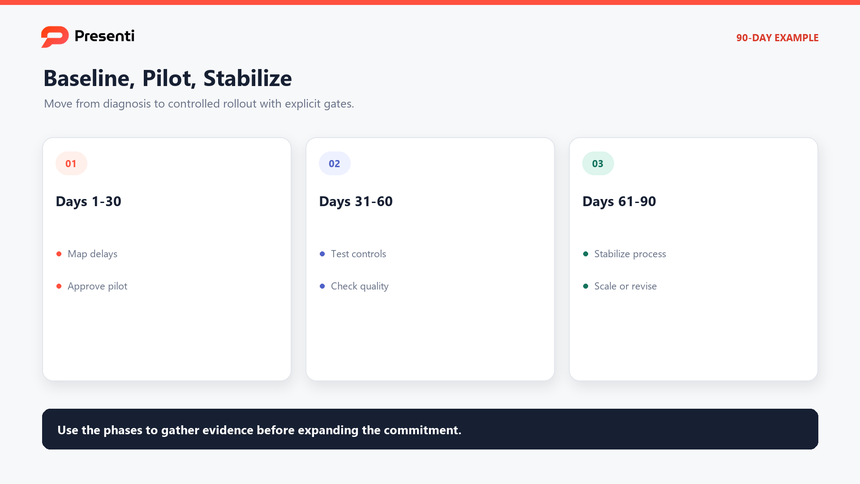
Imagine a customer operations team aiming to reduce onboarding time from 18 to 12 days while preserving quality. The first 90 days can move from diagnosis to controlled rollout rather than attempting an immediate company-wide change.
| Phase | Deliverables | Measures | Decision gate |
|---|---|---|---|
| Days 1-30: baseline | Process map, delay analysis, role ownership, data-quality sample | Cycle time by step, rework, wait time, exception frequency | Approve the target process and pilot scope |
| Days 31-60: pilot | Standard intake, two automated checks, training, exception review | First-pass completion, pilot cycle time, defect rate, staff load | Adjust controls or expand the pilot |
| Days 61-90: stabilize | Rollout plan, dashboard, governance cadence, contingency procedure | Median cycle time, quality, backlog, adoption, unresolved exceptions | Scale, hold, or revise the operating model |
Use medians or distribution views when a few extreme cases distort the average. Pair speed with quality so the team does not improve the headline metric by increasing rework. Mark illustrative values as examples and replace them with approved operational data before presenting.
The final roadmap should show owners above the work, not in a footnote. Identify the process owner, system owner, training owner, and decision-maker. Make the next review date and the evidence required for scale visible on the same slide.
How Can Presenti Turn an Operations Brief into an Editable Deck?
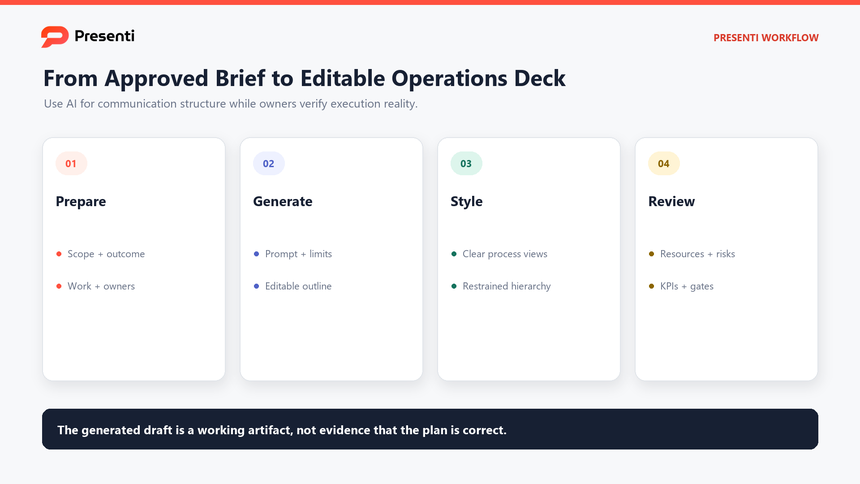
Presenti can convert a structured outline into an editable first draft through text to presentation. If the approved source is a Word document, PDF, or Markdown plan, the corresponding source-to-deck workflow may reduce copying, but review the source first and remove obsolete or restricted information.
If you need an operations plan PowerPoint, verify the editable draft and export settings after owner review.
To draft a customized operational plan with the limited free AI allowance, open Presenti, paste the checked brief, review the outline, and then choose a suitable style in the Presenti template center. Adapt the draft to your actual owners, dependencies, and resource constraints. Word/PDF imports and editable PPTX/PDF exports require an eligible paid plan.
Use the product after the operating decision has been framed. It can organize a sequence and provide visual options, but it does not know whether a resource is truly available, a dependency owner has committed, or a risk threshold is acceptable.
Step 1: Prepare the operating brief
List the objective, baseline, target, period, scope, workstreams, deliverables, owners, milestones, capacity, budget, dependencies, risks, KPIs, and decision gates. Identify any figures that remain estimates.
Step 2: Enter a constrained prompt
Use a prompt such as:
Create a 10-slide operations plan presentation for an executive review. Objective: reduce customer onboarding time from 18 to 12 days during the next quarter without increasing defects. Include the current-state gap, scope, operating model, four workstreams, owners, capacity, dependencies, risks, a 90-day roadmap, KPI thresholds, and the approval required. Treat all figures as illustrative placeholders unless supplied. Do not invent benchmarks or commitments.

Step 3: Review feasibility, then choose an operations template
Confirm that workstreams connect to the outcome and that resources, dependencies, and risks are not buried after the timeline. Remove generic strategy slides that do not affect the operational decision. Once feasibility and ownership are visible, preview a business template and choose a layout that can show milestones, dependencies, and decision gates clearly.

Step 4: Review the editable draft with owners
Ask each accountable owner to verify deliverables, dates, dependencies, and resources. Recalculate KPI baselines, label estimates, and check that risk triggers have practical responses. Rehearse the decision slides separately from the appendix.
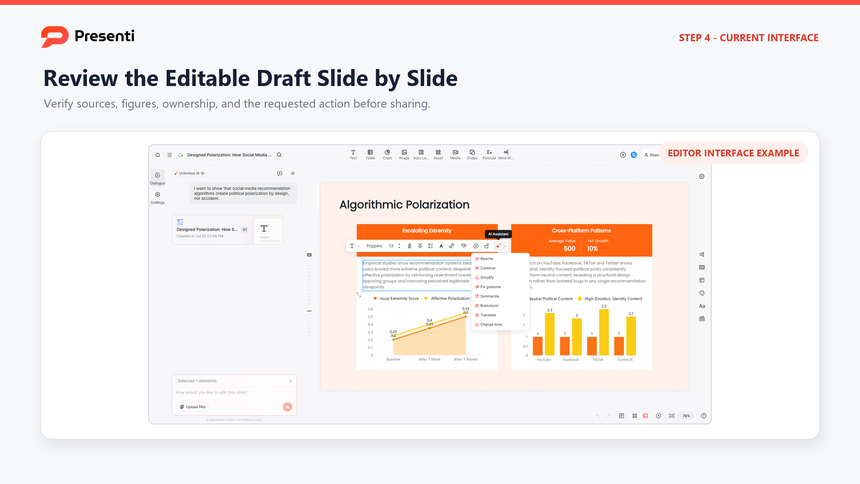
The draft is complete only when the operational owners can defend the plan and leaders can see the trade-offs behind it.
Frequently Asked Questions
What should an operations plan presentation include?
Include the operating objective, baseline, scope, workstreams, deliverables, owners, resources, timeline, dependencies, risks, KPIs, decision gates, and immediate next actions. Keep detailed tasks and procedures in the execution system or appendix.
What is the difference between a strategic plan and an operational plan?
A strategic plan defines longer-term direction and choices. An operational plan translates that direction into nearer-term deliverables, ownership, resources, measures, and control. The presentation should show the connection without repeating the entire strategy.
How many slides should an operations plan deck have?
About ten core slides are usually sufficient for an executive review. Simpler initiatives may need six to eight. Complex programs should keep the decision story concise and place detailed process maps, budgets, and task plans in an appendix.
Which KPIs should be shown?
Choose measures connected to the objective and workstreams. Include leading indicators of execution, outcome metrics, quality or customer safeguards, and thresholds that trigger action. Avoid a generic dashboard that does not change a decision.
How often should the plan be updated?
Update the execution system continuously and refresh the presentation when milestones, assumptions, capacity, risks, or decisions materially change. State the planned review cadence and next decision date in the deck.
Bottom Line
A useful operational plan template is a management system in compact form. It turns the operating logic into an operations plan presentation: define the outcome and scope, organize work around deliverables, show who owns each result, expose resource and dependency constraints, and set measures and decision gates. The slides should make execution easier to govern, not hide uncertainty behind polished timelines.