A DMAIC template should do more than display five colored stages. It should help a review team decide whether a process problem is defined tightly enough, measured consistently, explained by evidence, improved through a controlled test, and protected by a workable control plan. A decision-ready DMAIC presentation therefore connects every phase to an owner, source, finding, gate, and next action.
This guide gives you a ten-slide structure for Define, Measure, Analyze, Improve, and Control. It is designed for an existing process that is not meeting a performance standard or customer requirement. It is not a generic operations plan: an operations plan organizes recurring goals, resources, roles, and cadence, while DMAIC investigates a specific performance gap and tests a defensible improvement.

What Should a DMAIC Presentation Decide?
The deck should help sponsors make a sequence of decisions, not merely acknowledge that work happened. At Define, the decision is whether the problem deserves a project and the scope is workable. At Measure, it is whether the baseline can be trusted. At Analyze, it is whether the proposed root causes are supported. At Improve, it is whether the tested change is better and safe enough to implement. At Control, it is whether the process owner can sustain the gain and respond when performance moves.
The American Society for Quality's DMAIC overview describes DMAIC as a structured approach for improving an existing process that does not meet performance standards or customer expectations. That boundary matters. Use DMAIC when a repeatable process exists, the gap can be measured, and the cause is not yet proven. Do not force it onto a new product design, a broad transformation with no measurable process, or routine work that only needs an owner and schedule.
Start with a charter that can survive a skeptical read. Include the business or customer effect, current condition, target condition, in-scope start and end points, exclusions, sponsor, process owner, team, timeline, and decision requested. The problem statement should describe the observed gap without naming an assumed cause or preferred fix.
| Charter field | Question the slide must answer | Weak version to avoid |
|---|---|---|
| Problem statement | What is happening, where, since when, and at what verified magnitude? | "The team is inefficient because the software is old." |
| Goal statement | Which metric should move from what baseline to what target by when? | "Improve quality as soon as possible." |
| Scope | Which process boundaries, locations, products, or customer groups are included? | "Fix the whole operation." |
| Business case | Why does this gap matter to customers, risk, cost, time, or quality? | A benefit estimate presented as a verified result |
| Ownership | Who sponsors the project, owns the process, and accepts the final control plan? | A project team with no receiving owner |

Which Slides Belong in a DMAIC Deck?
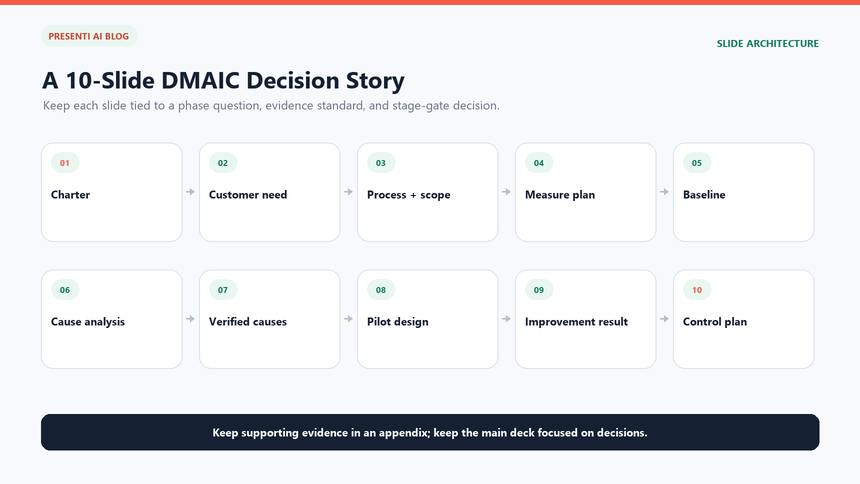
A working DMAIC PowerPoint template can fit the main decision story into ten slides. Keep raw data, detailed calculations, measurement-system work, interview notes, and tool outputs in an appendix. The main deck should allow a sponsor to trace the original gap through the verified baseline, causal evidence, tested change, and control ownership.
- Decision summary. State the problem, verified baseline, tested result, residual risk, and decision needed. Update this slide as the project advances.
- Define: charter and customer requirement. Show the problem and goal statements, critical requirement, scope, sponsor, process owner, and timeline.
- Define: process boundary. Use a high-level map or SIPOC to establish where the process begins and ends, who supplies inputs, and who receives outputs.
- Measure: metric and collection plan. Give the operational definition, unit, numerator and denominator where relevant, source, owner, frequency, exclusions, and quality checks.
- Measure: baseline. Show current performance over a defined period, meaningful segmentation, sample details, missing data, and limitations.
- Analyze: root cause evidence. Compare candidate causes with tests, results, strength of evidence, and remaining uncertainty.
- Improve: solution selection. Explain how options were screened for expected effect, feasibility, risk, cost, and unintended consequences.
- Improve: pilot or test result. Compare pre-test and post-test conditions, state the test window and population, and include balancing measures.
- Control: sustainment plan. Name the metric, limit or trigger, monitoring frequency, process owner, response, and escalation path.
- Stage-gate decision and next actions. Record which gate is being requested, what remains open, who owns each action, and when the next review occurs.
A project does not need to wait until Control to use this structure. During Define, later slides can be clearly marked "not yet tested." During Analyze, the summary can state that improvement results are pending. This prevents a blank template from implying evidence that the team has not collected.
What Evidence Belongs in Define, Measure, Analyze, Improve, and Control?
A Six Sigma DMAIC template becomes useful when it distinguishes an activity from a deliverable and a deliverable from evidence. "Held a root-cause workshop" is an activity. A fishbone diagram is a deliverable. A factor associated with the defect after a suitable test is evidence. The slide should show which of those three levels the team has actually reached.
Define: establish the case and boundary
Show the charter, problem statement, goal, customer requirement, scope, and process boundary. If a cost or benefit number is estimated, label the assumption and method. A Define gate should not approve a solution; it should approve the problem, scope, ownership, and plan to learn.
Measure: establish a comparable baseline
Define the metric so two informed people would collect it the same way. The ASQ guidance on performance metrics describes an operational definition as a detailed but understandable description of the measurement process. In the slide, specify the event that starts and ends a cycle time, the defect rule, unit of analysis, inclusion and exclusion criteria, source system, collection frequency, sample, and data-quality check. Then show the baseline with its date range and segmentation.
Analyze: test causes instead of decorating them
Begin with candidate causes from process observation, subject-matter knowledge, and structured tools. Then show how each candidate was checked. Depending on the problem, evidence might include stratified comparisons, a Pareto view, time sequence, process walk, verified failure mode, controlled test, regression, or another method chosen by a qualified analyst. Do not present correlation as proof of mechanism, and do not hide a weak sample behind a polished chart.
Improve: test a change under defined conditions
State why the selected change should affect the verified cause. Show the pilot population, start and end dates, comparison condition, implementation fidelity, outcome measure, process measure, and at least one balancing measure. The result should distinguish observed movement from a forecast. If the pilot is incomplete, ask for the next test rather than approval for full rollout.
Control: transfer ownership with a response rule
A control plan should specify what will be monitored, by whom, how often, against which trigger, and what happens when the trigger is crossed. It should also identify the current procedure, training or error-proofing change, record location, review cadence, and escalation owner. A chart without a response rule is monitoring, not control.
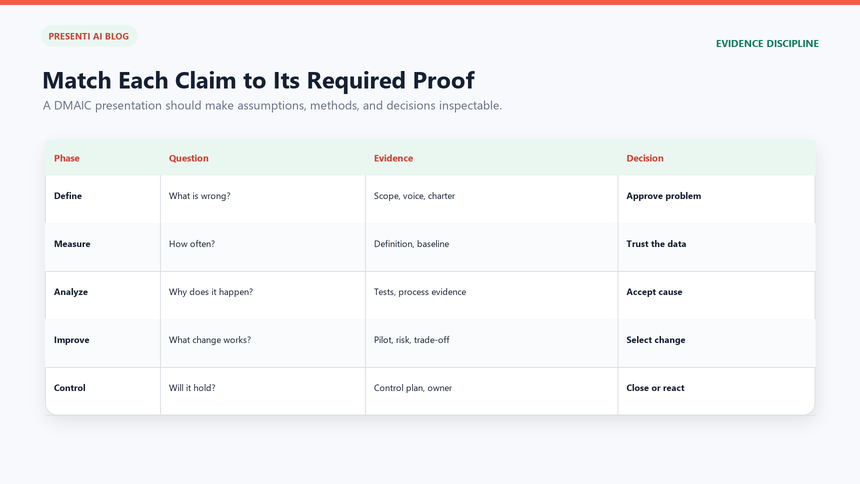
| Phase | Minimum evidence | Gate question | Do not claim yet |
|---|---|---|---|
| Define | Verified gap, customer requirement, charter, scope, and owner | Are we solving the right bounded problem? | Root cause or solution effect |
| Measure | Operational definition, collection plan, quality check, and baseline | Can the team trust and reproduce the measurement? | Cause from an unsegmented average |
| Analyze | Tested candidate causes and documented uncertainty | Which inputs credibly explain the gap? | That every brainstormed cause is real |
| Improve | Selection logic, defined test, outcome and balancing measures | Did the change improve performance without unacceptable harm? | Full-scale result from a limited pilot |
| Control | Owner, metric, trigger, cadence, reaction, and handoff | Can the process owner detect and respond to drift? | Permanent gain before sufficient follow-up |
How Do Stage Gates and a Control Plan Keep DMAIC Honest?
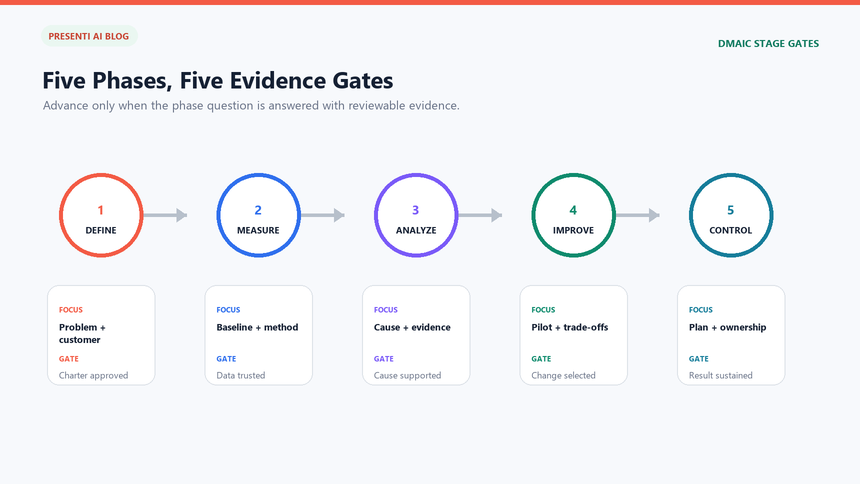
Stage gates create permission to proceed. They should not become ceremonial meetings where every phase is marked green. For each gate, list required evidence, open risks, approver, approval date, conditions, and the next review. If the baseline changes because the operational definition was corrected, return to Measure and restate the comparison rather than carrying an incompatible number forward.
| Gate | Approve only when | Possible decision |
|---|---|---|
| Define to Measure | The gap, scope, customer requirement, sponsor, process owner, and data plan are clear | Proceed, revise charter, or stop |
| Measure to Analyze | The metric is operationally defined, the collection method is credible, and a dated baseline exists | Proceed, repair measurement, or rescope |
| Analyze to Improve | Priority causes have evidence strong enough to justify a test | Test, gather more evidence, or reject cause |
| Improve to Control | The solution was tested, results and balancing measures were reviewed, and risk is acceptable | Implement, extend test, modify, or stop |
| Control to close | The process owner accepts the control plan, reaction rule, documentation, and follow-up schedule | Close, continue monitoring, or reopen |
Make the control plan operational. A useful row might read: "Monitor first-pass yield daily from the production record; the line supervisor reviews by 10:00; if the value falls below the approved threshold or a nonrandom pattern appears, hold affected work, verify the measurement, open a cause review, and notify the process owner." The actual threshold and statistical rule must come from the approved process analysis, not from a generic template.
When a control chart is appropriate, explain what the center line and limits represent and who is qualified to interpret the signal. The NIST/SEMATECH e-Handbook description of control charts notes that a chart typically includes a center line for the in-control process and can be interpreted for nonrandom patterns. Do not turn a target or specification limit into a control limit without valid analysis.
What Does a Practical DMAIC Example Look Like?
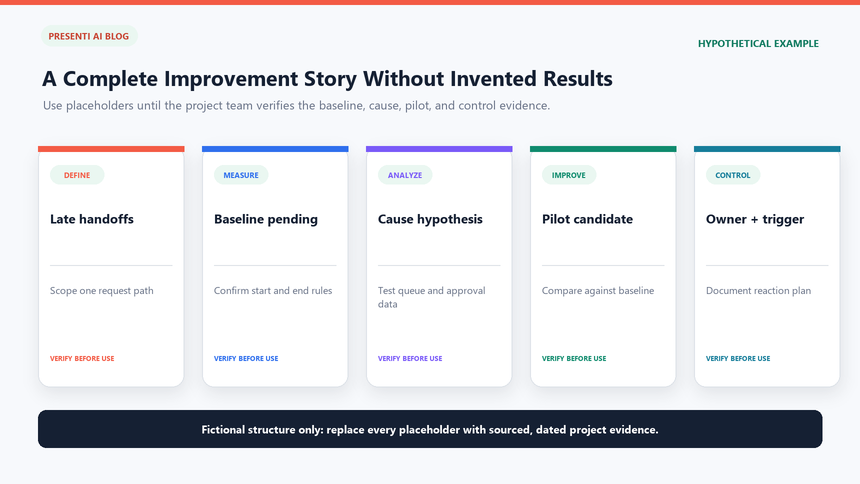
The following example is hypothetical. Its dates, values, causes, test result, and control thresholds are invented to demonstrate the presentation logic; they are not customer results or Presenti performance claims.
Suppose a regional distributor is reviewing late dispatches from one fulfillment process. In Define, the team states that 18% of eligible weekday orders missed the 4:00 p.m. carrier cutoff during an eight-week baseline, compared with an internal requirement of no more than 8%. The scope begins when a validated order enters the release queue and ends when the shipment receives a carrier scan. The goal is to reduce the late-dispatch rate to 8% or less by the end of a twelve-week project without increasing picking errors.
In Measure, the team defines a late dispatch as an eligible order released before noon but lacking a carrier scan by 4:00 p.m. on the same scheduled shipping day. The dataset excludes customer holds, weather closures, and orders with approved future ship dates. The slide shows the source, collection owner, eight-week period, order count, missing records, and a check comparing system timestamps with a sample of dock records.
In Analyze, a process walk and segmented data produce three candidate causes: batching at order release, staffing by day, and label-printer downtime. The deck does not simply show a fishbone diagram. It reports which comparisons support each candidate, what alternative explanations remain, and why batching at release is the priority mechanism for a controlled test. Printer downtime is retained as a secondary risk rather than declared a root cause.
In Improve, the hypothetical team tests staggered release windows for two weeks in one comparable order stream. The late-dispatch rate falls from 18% in the stated baseline to 9% in the defined pilot population, while the picking-error balancing measure remains within its reviewed range. These fictional values illustrate how to label conditions and limits; they do not establish causality or justify rollout in a real operation without a suitable design and review.
The pilot’s 9% late-dispatch rate still exceeds the 8% goal. The team must decide whether to extend the test or allow limited implementation with that gap explicitly accepted. In Control, the process owner accepts the release schedule, daily late-dispatch measure, weekly trend review, defined trigger, verification step, escalation path, and a 30-day follow-up. The closing slide requests conditional implementation, records the remaining printer risk, and assigns a date for checking whether the gain persists.
How Can You Get a Free Editable DMAIC Template with Presenti?

Once the charter, baseline, causal evidence, test result, and control ownership are assembled, Presenti can organize them into an editable first draft. Use text to presentation when the approved material is already in a written brief, or begin from a compatible source document. Then review the outline before selecting a visual design from the presentation template center. This is a practical way to get a free editable starting template shaped around your project instead of forcing the evidence into a static download.
The workflow can shorten the formatting and structuring stage, but it cannot validate a measurement system, select the correct statistical method, prove a root cause, or approve a control threshold. Keep the process owner, subject-matter experts, and qualified analyst responsible for the evidence and the stage-gate decision.
Step 1: Enter the checked brief or source
Include the audience, current DMAIC phase, problem and goal statements, process boundary, operational definitions, baseline period, candidate causes and tests, solution-test conditions, balancing measures, control owner, and requested gate. Remove confidential or personal information unless its use is approved. A constrained prompt can be:
Create a 10-slide DMAIC presentation for a sponsor gate review. Audience: operations leadership, process owner, finance partner, and improvement team. Use slides for the decision summary, charter and customer requirement, process boundary, operational definition and data plan, baseline, root-cause evidence, solution selection, pilot result, control plan, and gate decision. Label unverified values as placeholders. Do not invent baseline data, root causes, savings, test results, control limits, or approvals.
Check: the request must identify the decision and evidence boundary. If a phase is unfinished, ask for a visible status label rather than fabricated completion.
Step 2: Review the proposed outline
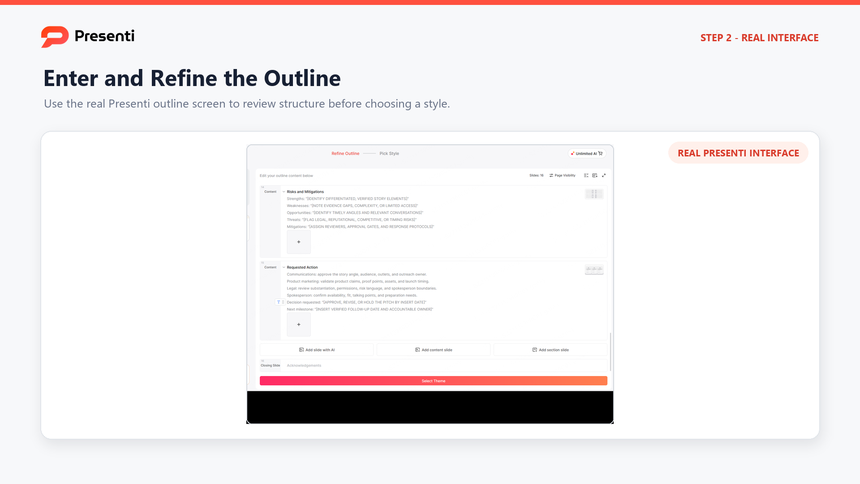
Check that the outline preserves the causal sequence: gap, measure, baseline, tested cause, tested change, and control. Remove generic slides that do not advance the gate. Add a limitations note where the sample, comparison, or measurement quality constrains the conclusion.
Step 3: Choose a template that supports evidence
Select a business or process-improvement design only after the structure is correct. Favor layouts with readable tables, charts, comparison panels, and timelines. A five-stage cycle can orient the reader, but it should not replace the baseline, cause test, pilot result, or control plan.

Step 4: Edit and verify every claim
Compare the generated slides with the source record. Check the scope, dates, denominators, filters, units, chart axes, candidate causes, statistical language, pilot conditions, savings assumptions, process owner, and reaction plan. Replace placeholders and remove speaker notes or internal comments that should not be shared.

Step 5: Export after the gate review
After the evidence owners approve the content, export the editable file on an eligible paid plan and reopen it. Check fonts, chart labels, table wrapping, links, notes, image clarity, and confidential material. Record the version and approval date so a later review can distinguish the decision deck from an earlier working draft.

The finished deck should make the gate decision easier to inspect. It should never make incomplete analysis look complete.
Frequently Asked Questions
What is a DMAIC template?
It is a repeatable structure for documenting Define, Measure, Analyze, Improve, and Control. A useful version includes the charter, problem and goal statements, process boundary, operational definitions, baseline, root-cause evidence, solution test, control plan, and stage-gate decisions.
When should you use DMAIC instead of an operations plan?
Use DMAIC when an existing process has a measurable performance gap and the cause or best solution is not yet proven. Use an operations plan when the goal is to coordinate recurring priorities, resources, responsibilities, measures, and review cadence. One can hand off into the other after an improvement is accepted.
Can I use DMAIC without Six Sigma certification?
The structure can support a range of improvement work, but the analysis must match the stakes and data. Involve a qualified quality, process, statistical, safety, financial, legal, or domain reviewer when conclusions depend on specialized methods or carry material risk.
What belongs in a DMAIC project charter?
Include the verified problem, customer or business effect, goal, primary measure, scope and exclusions, sponsor, process owner, team, broad timeline, assumptions, constraints, and current decision request. Do not state an assumed root cause inside the problem statement.
How is an operational definition different from a KPI name?
A KPI name says what you intend to track. An operational definition says exactly how the value is produced, including the unit, event or defect rule, start and end conditions, numerator and denominator where applicable, population, exclusions, source, frequency, and owner.
What should a DMAIC control plan include?
Include the metric, source, owner, monitoring cadence, valid trigger or signal, verification step, response, escalation path, procedure location, training or mistake-proofing change, and follow-up date. State who receives the process after the project team exits.
Bottom Line
A strong DMAIC template makes the chain of reasoning visible from the first verified gap to the final control handoff. Define the bounded problem, measure it with a reproducible rule, test root causes, compare a limited solution under known conditions, and give the process owner a specific monitoring and reaction plan. Use the deck to support stage-gate decisions, not to disguise assumptions as evidence; that is what turns a DMAIC template from a five-step graphic into a working improvement record.