A market size slide should show who could buy, what one customer is worth over a stated period, and how those two inputs produce the estimate. Keep the total opportunity separate from the customers your current offer can serve and the sales your team might actually reach. A large market figure cannot substitute for a believable route to a first customer.
Start with the calculation, then design the slide around it. Once the customer definition and assumptions are clear, you can build a pitch deck from your business material and edit the market exhibit alongside the rest of the story. The draft should explain your numbers, not supply missing evidence for them.
Define one customer before multiplying anything
Suppose you sell a subscription to a business with several locations. A directory might count business names, individual premises or legal entities. Your billing system might charge per company, site or user. Multiplying a location count by a company subscription price creates a plausible-looking number with incompatible units.
Write the counting rule in one sentence: “One customer is one independently owned repair business with one billing account, regardless of how many locations it operates.” Then give the geography, business type and exclusions. If a franchise group buys centrally, its premises are not automatically separate customers. If the product cannot serve a particular business type, its spending does not become available merely because a broad industry report includes it.
Sequoia’s business-plan outline includes defining customers and the market. The useful question for this one slide is narrower: can the audience follow the particular customer boundary behind your estimate?
Work a bottom-up example with compatible units
Consider a fictional scheduling service for independent vehicle-repair businesses in a defined region. All counts, prices and sales assumptions below are illustrative, not measured market data. The service charges per business account. Its first release supports only businesses with two to ten locations that can operate in its supported language.
| Input | Example value | What it counts |
|---|---|---|
| Broad customer population | 8,400 businesses | Independent repair businesses in the chosen region, counted once each |
| Businesses with two to ten locations | 2,100 businesses | A subset of the 8,400, not an additional population |
| Initially serviceable customers | 1,600 businesses | Those within the size range and supported operating language |
| Subscription assumption | $150 per business per month | One account covering that business; no per-location multiplier |
| Annual value per account | $1,800 | $150 × 12 months, before any discounts or churn assumptions |
The broad annual subscription opportunity is 8,400 businesses × $1,800 per business per year = $15.12 million per year. The initially serviceable opportunity is 1,600 × $1,800 = $2.88 million per year. Both figures describe full adoption at the stated price within their respective populations. Neither is a forecast of what the company will sell.
The broad figure also assumes that an eventual offer can serve the wider population at this price. If that expansion is not plausible, remove or narrow it. A smaller estimate with a defensible boundary is more useful than a larger one built from customers the business has no plan to serve.
TAM, SAM and SOM are common labels for total, serviceable and obtainable market estimates. Define the meaning you use on the slide. In this example, the first two figures can be labeled TAM and initial SAM. An obtainable-sales figure needs a separate time horizon and operating assumptions; it does not emerge by taking an unexplained percentage of TAM.
Make the customer count traceable
In a real calculation, the row “8,400 businesses” needs more than the name of a large industry. Keep a supporting sheet showing the underlying source, publication or extraction date, geography, unit and filters. The audience should be able to tell whether you counted companies, establishments, members of an association or respondents to a survey.
For a directory-based estimate, keep both the original records and the deduplicated list. Explain how multiple locations were grouped into one buying account, how inactive listings were handled, and which exclusions created the serviceable subset. Do not present a directory as a complete census unless its coverage supports that claim.
A report can provide a useful cross-check, but its total may measure a different thing. Industry revenue includes spending that your subscription does not replace. A count of all automotive premises may include dealerships or single-site shops outside the initial offer. A mismatch is a reason to reconcile definitions, not to average the two estimates.
On the slide itself, use a short source note with the date and counting unit. Put the longer source-and-filter table in the appendix. Label your own price and adoption assumptions separately from externally sourced customer counts so they do not appear to have equal evidential status.
Separate market size from first-year sales
Now ask what the fictional team could reach in its first twelve months. Assume it can contact 400 unique, qualified businesses from the serviceable segment. Suppose 25% start a trial and 30% of those trial users become paying accounts. These are planning assumptions, not demonstrated conversion rates.
400 contacted businesses × 25% trial rate × 30% trial-to-paid rate = 30 new paying accounts. The second percentage uses trial accounts as its denominator, not all contacted businesses. Repeat contacts with the same company do not increase the count of unique opportunities.
If all 30 remain active at year-end at $150 per month, their annualized subscription run rate is 30 × $150 × 12 = $54,000. That is not the amount collected during the first year. If the cohort schedule totals 180 paid account-months during that year—an average of six per account—the corresponding subscription charges are 180 × $150 = $27,000, before any relevant discounts, refunds or other adjustments.
Those numbers can coexist without contradiction: $2.88 million is the full annual opportunity in the initial segment; $54,000 is the example’s year-end annualized run rate; $27,000 is the first-year charge scenario. Put them in different visual groups. A pitch that labels all three simply “revenue” asks the audience to resolve a confusion the slide created.
If you include an obtainable-market estimate, state whether it means active accounts at a particular date, annual sales within a period or another defined measure. The route to those accounts should be supported by a channel and capacity plan, rather than a claim that a small market share will be easy to win.

Change one assumption and show the effect
A sensitivity example makes the model easier to question. Keep the 1,600 serviceable businesses fixed and vary only the monthly account price:
| Monthly price assumption | Annual value per account | Full annual opportunity in the initial segment |
|---|---|---|
| $120 | $1,440 | $2.304 million |
| $150 | $1,800 | $2.880 million |
| $180 | $2,160 | $3.456 million |
This is an arithmetic range, not a confidence interval or evidence that customers will accept any of these prices. A higher price may affect adoption, so do not quietly keep the same conversion forecast while presenting the upper value as the likely result. Show which assumption changed and what remained fixed.
The same discipline applies to account counts. If your list contains 1,600 possible buyers but ownership is unresolved for some entries, show that uncertainty in the account model. Extra decimal places do not make an uncertain population precise.
Turn the model into one readable slide
The main slide needs fewer numbers than the working sheet. For this example, a useful headline is “The initial segment contains 1,600 serviceable business accounts.” Below it, show the annual opportunity as a visible equation, with a small population boundary beside it. A separate band can carry the twelve-month sales scenario.
Initial segment: 1,600 independent repair businesses with two to ten locations, in the supported region and language.
Annual opportunity: 1,600 accounts × $1,800 per account = $2.88 million at full adoption.
First twelve months: 400 qualified contacts → 100 trials → 30 new paying accounts under the stated assumptions.
Boundary: Illustrative model; account counts and price require evidence for a real pitch.
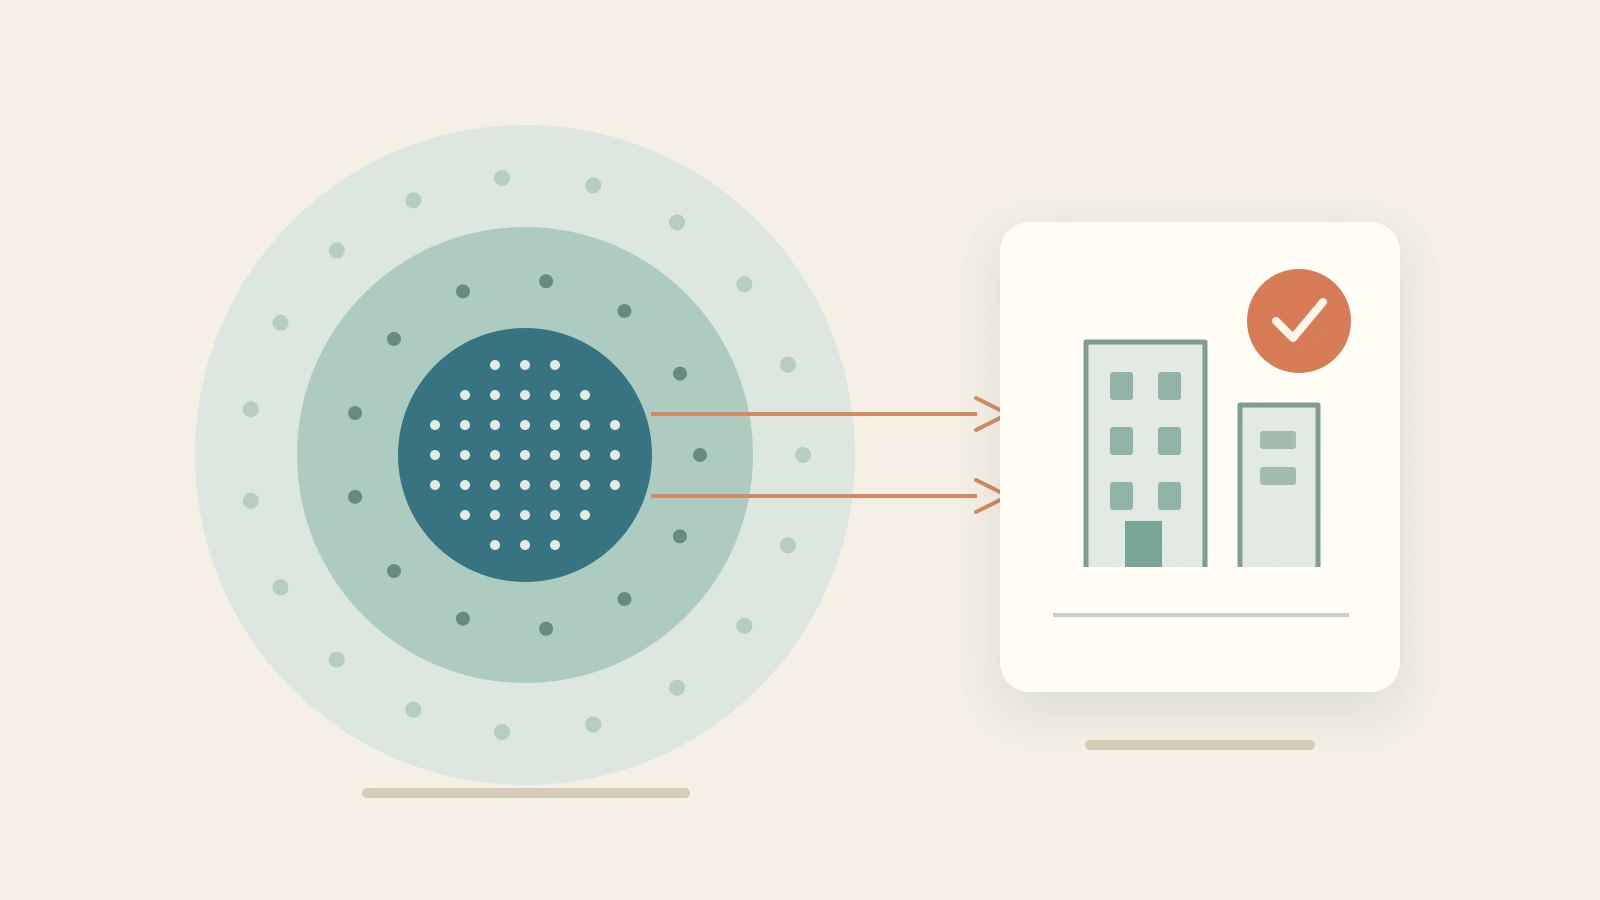
Use nested areas only when the populations really are subsets. Do not draw circles whose relative sizes suggest measured proportions if they are merely decorative. The source note and the “full adoption” qualifier must remain readable; they are part of the meaning, not footnote clutter.
Keep the detailed conversion model and price sensitivity on supporting slides if the market slide becomes crowded. When explaining the exhibit, move from buyer definition to calculation, then to what the team can attempt next. The audience can then question one input without having to reconstruct the whole model.
For a slide draft, supply the customer definition, count provenance, price period and separate sales assumptions as distinct pieces of text. After drafting, compare every displayed value with the working sheet. In particular, check that “per business,” “per year” and the sales horizon survived the layout. Those small labels are what keep a market opportunity from turning into an unsupported promise.