A useful quarterly business review connects the customer's agreed goals with what happened, what the evidence means and what both teams will do next. Start with that discussion, then choose the slides. A dashboard full of activity is not enough if nobody can explain its relevance to the customer.
This guide focuses on a customer-success QBR. It includes a fictional adoption example, a five-slide narrative and a copyable source brief. The figures illustrate the method; they are not customer results or evidence of a product test.
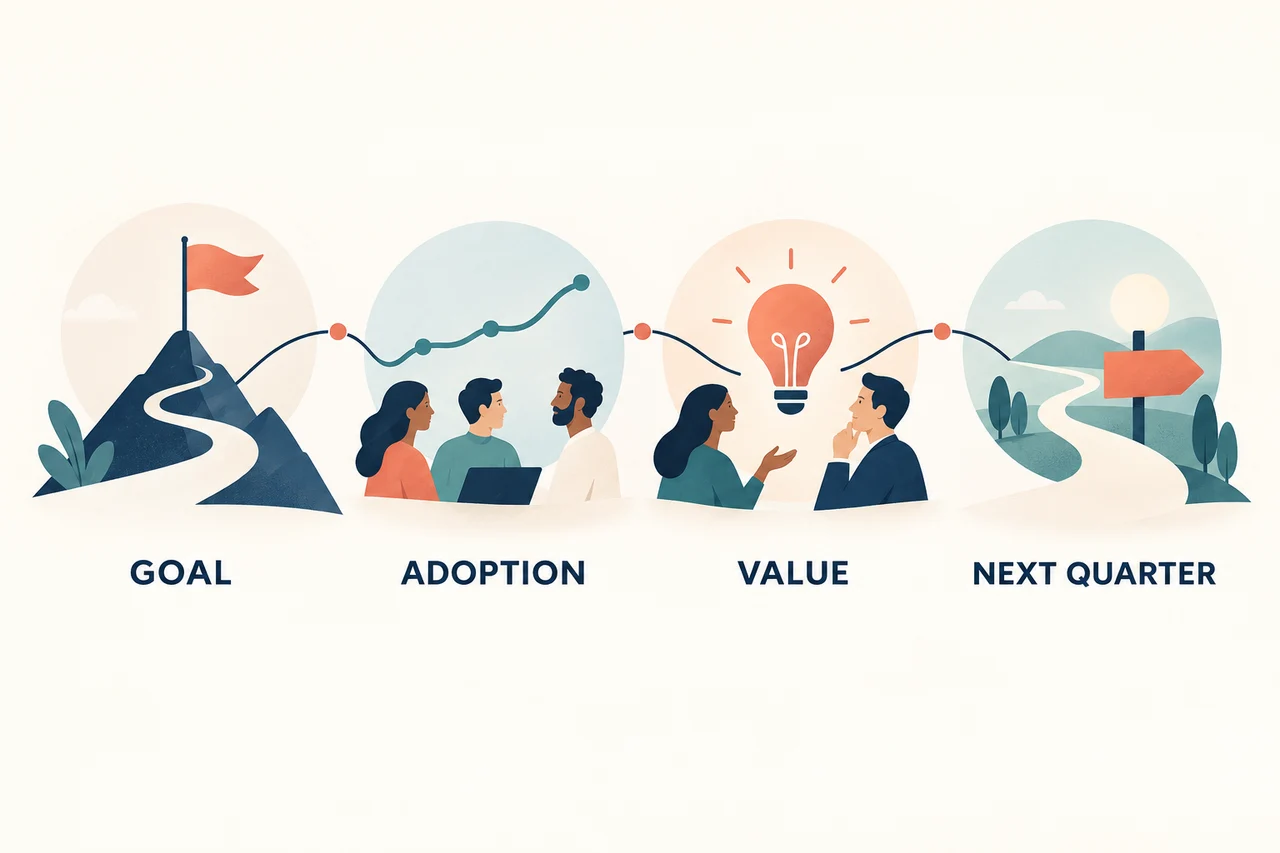
Build the QBR around five customer questions
1. What matters most this quarter?
Open with the customer's goal and the main finding. If you measured adoption but not a financial return, say so. “More eligible users completed the core task” is a different claim from “the product delivered a return on investment.”
2. How did actual performance compare with the agreed target?
Show the metric definition, the period, the target and the actual result together. A percentage without its denominator can hide a change in the eligible population. Keep the comparison consistent before deciding whether a result is good or bad.
3. What does usage tell us about value?
Usage can help locate a question worth investigating. It does not by itself prove satisfaction, productivity or retention. Explain which behavior the metric records and what additional evidence would be needed to connect that behavior to the customer's goal.
4. What is getting in the way?
Separate observed obstacles from possible explanations. A customer comment can suggest a problem with onboarding; it does not establish that onboarding caused every inactive user. Show the evidence, the hypothesis and the next investigation distinctly.
5. What will each team do next?
End with a short action plan containing an owner, a due date and a review point. Treat new commitments as proposals until the responsible people agree. Keep feature requests separate from a committed product roadmap.
Worked example: turn adoption figures into a QBR story
In this fictional account, the customer wants more of its licensed team to use one core workflow. The same 200 users are eligible in both quarters. An “active user” means a unique eligible user who completed that workflow at least once during the quarter.
The agreed Q3 target is 160 active users. The source data is:
| Measure | Q2 2026 actual | Q3 2026 actual | Q3 target |
|---|---|---|---|
| Eligible users, same cohort | 200 | 200 | 200 |
| Active users | 120 | 150 | 160 |
| Adoption rate | 60% | 75% | 80% |
The calculation is active users ÷ eligible users × 100. Adoption increased from 60% to 75%, a rise of 15 percentage points. There are 30 more active users than in Q2, but Q3 remains 10 users, or 5 percentage points, below target.
A relative increase would be 25%: (75 − 60) ÷ 60 × 100. Do not write “adoption increased by 15%” when you mean a 15-percentage-point change. For this QBR, the percentage-point change and the remaining gap are the clearer comparison.
Write the headline the data supports
Useful headline: “Adoption rose to 75%, with ten more active users needed to reach the target.”
Unsupported headline: “Training increased customer productivity by 25%.” The table contains no training exposure, productivity measurement or causal analysis. The arithmetic does not justify that claim.
Before drafting, place these definitions and figures in one approved source brief. A presentation tool can help organize that material; it should not be asked to invent the missing explanation.
For the adoption slide, compare the three rates on the same scale, label actual and target clearly, and retain the 200-user denominator. A small labeled chart or the table above is sufficient; a decorative dashboard adds little if it obscures the definition.
Turn the evidence into five slides
| Slide | Suggested title | Evidence or discussion |
|---|---|---|
| 1. Executive summary | Adoption improved, but the agreed target remains unmet | 75% actual; 80% target; the same 200 eligible users |
| 2. Performance | Thirty more users completed the core workflow | 120 in Q2 versus 150 in Q3; metric definition and period |
| 3. Customer interpretation | We need to understand the remaining adoption gap | What account records or customer feedback can explain; what remains unknown |
| 4. Proposed actions | Validate the barriers before choosing an intervention | Named investigation and review tasks, proposed for agreement |
| 5. Next review | Agree on owners and the evidence needed next | Action dates, next discussion and any target changes to approve |
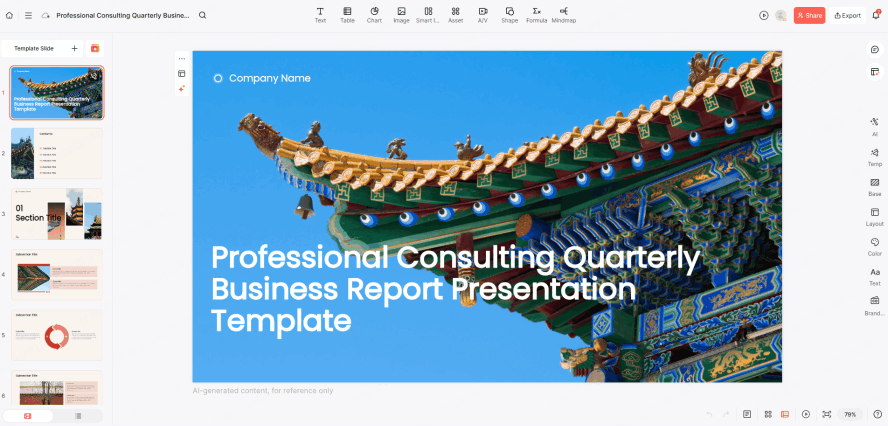
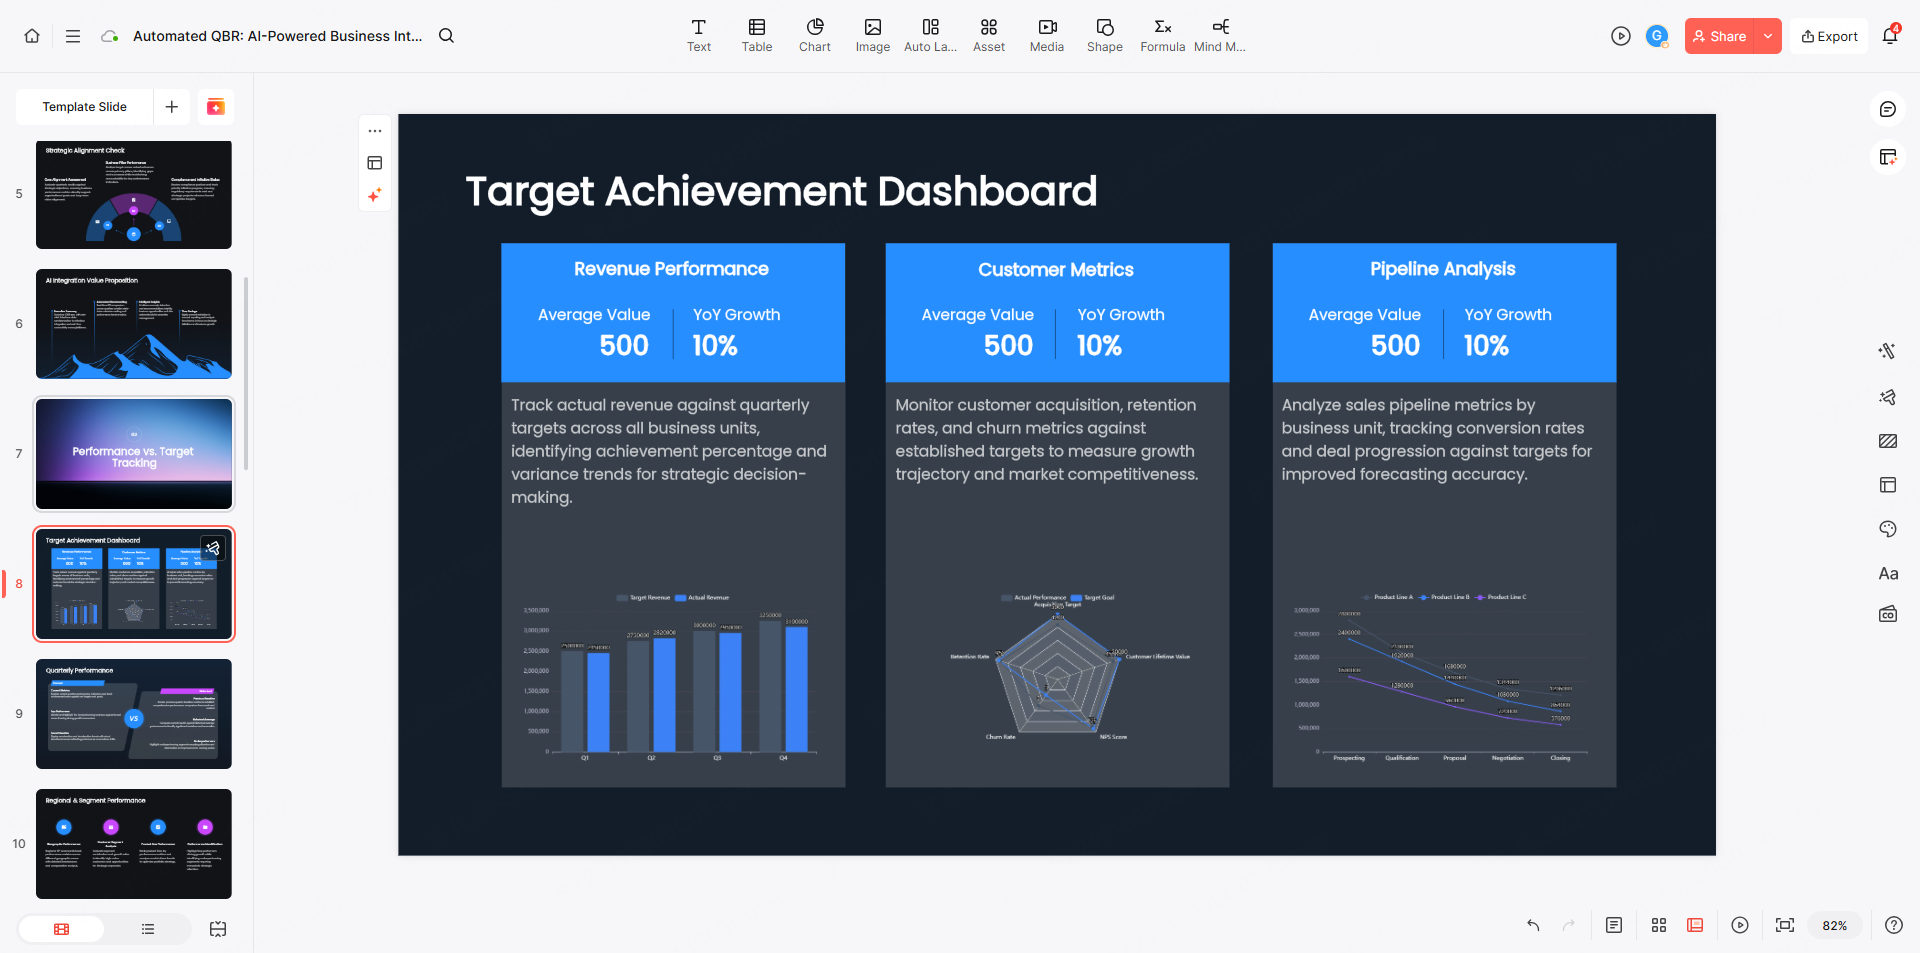
A QBR template can provide useful places for these sections. Replace its example text and placeholder numbers with the approved source; a template's chart is not account evidence.
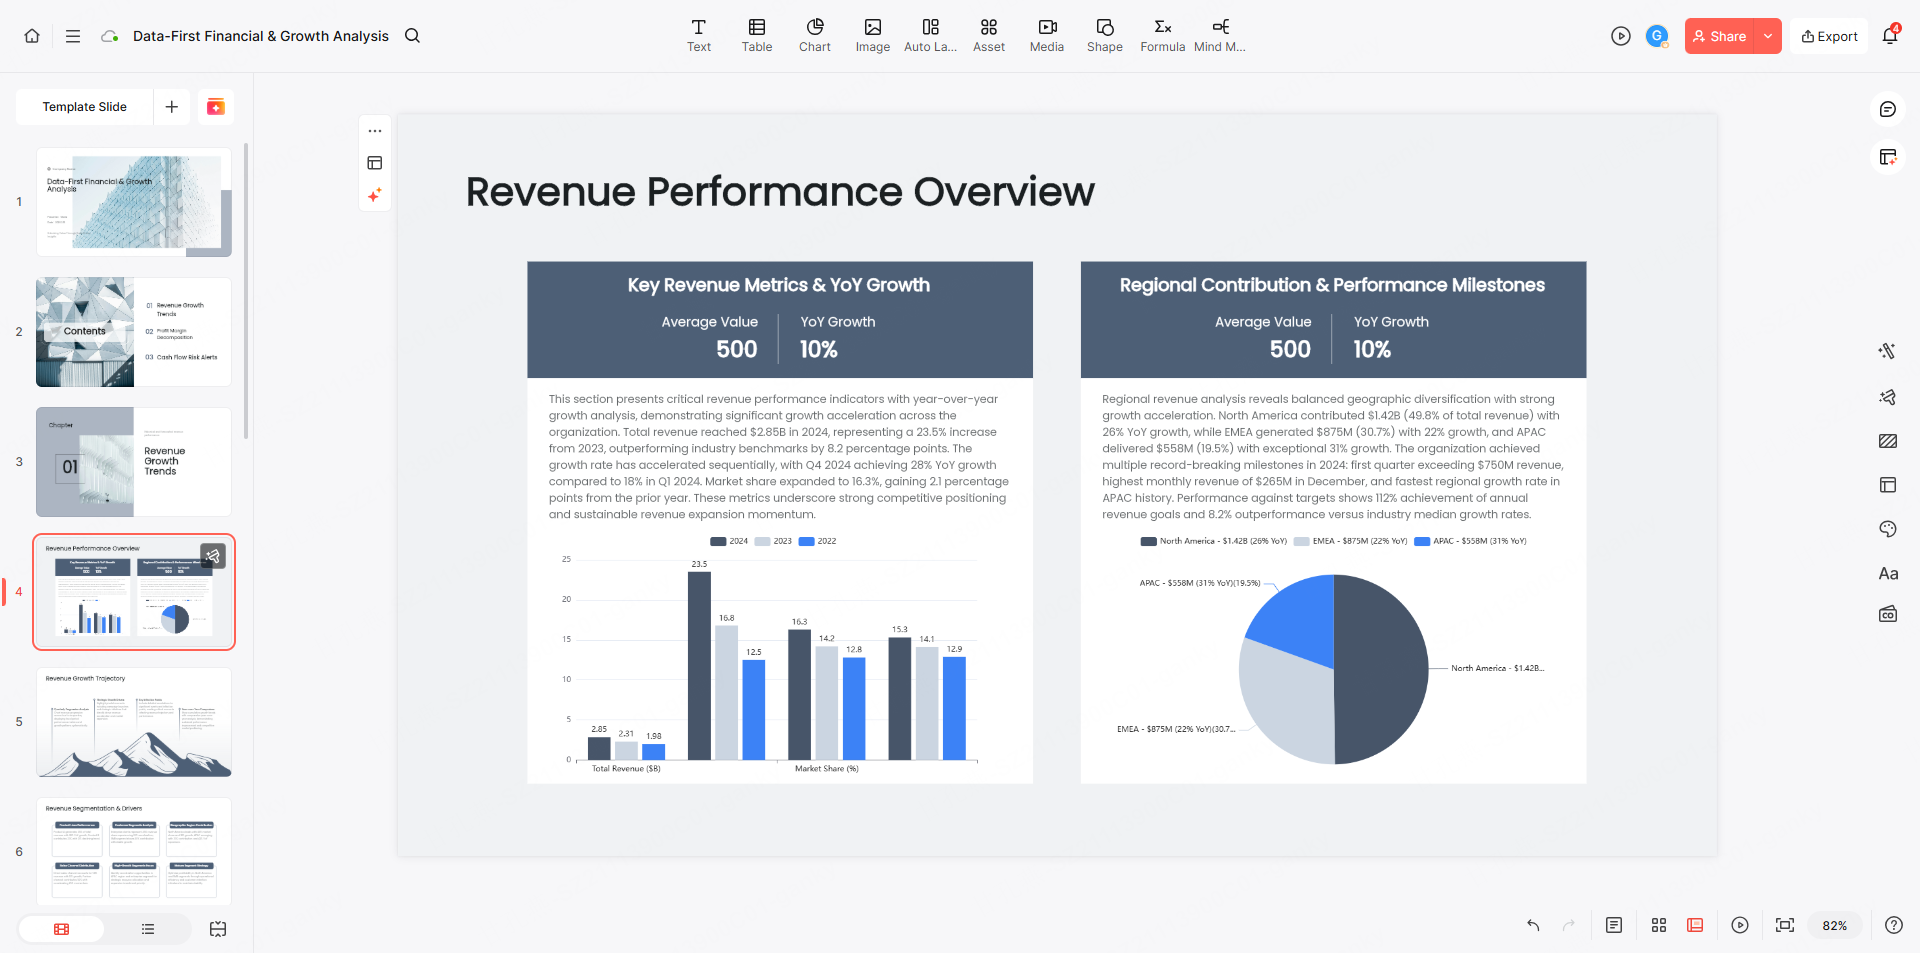
If the customer has an agreed financial objective and verified financial data, add the relevant outcome. Otherwise, leave a financial-return slide out. The financial layout below is an optional design reference, not a reason to manufacture an ROI calculation for this adoption example.
Draft the QBR in Presenti from approved information
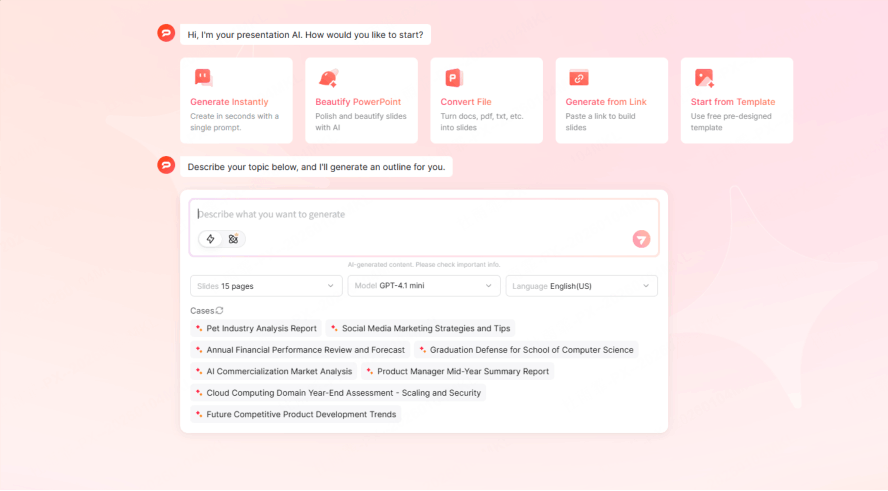
Presenti can help turn a topic or supported source document into an outline and slide draft. Prepare the figures and definitions first, then provide the five-slide sequence. This workflow does not require a live CRM connection, an automatic CSV analysis or a predicted renewal outcome.
Review the outline before generating slides. Keep the customer goal near the opening, place the actual/target comparison before the interpretation, and label recommendations as proposed. Word/PDF/TXT imports and PPTX/PDF export depend on the current plan.
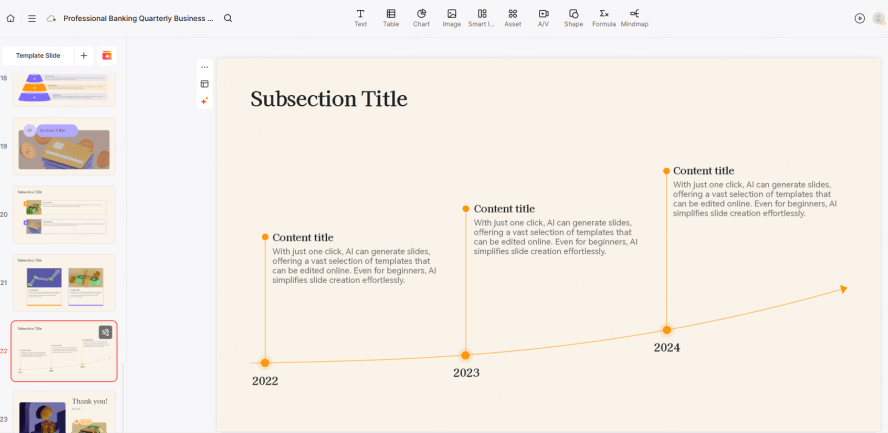
Choose layouts by the question. The metric comparison needs readable labels; the action slide needs owners and dates. A timeline is helpful when the sequence matters, but do not fill it with uncommitted milestones to make it look complete.
After generation, compare each number and claim with the source brief. Then inspect the exported file in the application the customer will use, including the denominator note and the distinction between actual results and targets.
Make the next actions specific without inventing commitments
For the fictional account, the following table could be proposed during the QBR. These actions have not been recorded as agreed in the example data.
| Proposed action | Proposed owner | Proposed due date | Evidence to bring back |
|---|---|---|---|
| Confirm the eligible-user list and measurement definition | Customer operations lead | 9 October 2026 | Approved list and definition |
| Collect feedback about barriers to the core workflow | Customer team leads | 16 October 2026 | Documented observations, with their scope stated |
| Review the evidence and choose the next intervention | Account owner and customer sponsor | 20 October 2026 | Agreed action, owner and success measure |
During the meeting, confirm or change each owner and date. If the customer changes the eligible population or the definition of activity, show that change in the next report; otherwise, a new rate may look comparable when it is not.
Keep open questions visible. For example: “Does completing the core workflow once represent enough use to meet the customer's goal?” That question can improve the next quarter's measurement more than another decorative KPI card.
Copy this QBR source brief
CUSTOMER QBR BRIEF
Customer and audience: [account, roles]
Quarter under review: [start and end dates]
Customer goal: [agreed outcome]

For every metric, provide:
- Definition and unit
- Eligible population or denominator
- Source and owner of the data
- Prior-period actual, current actual and agreed target
- Changes in scope or measurement

Separate:
- Observed results
- Customer feedback and its scope
- Possible explanations that still need evidence
- Proposed actions requiring agreement

Draft five slides: executive summary, performance against target,
interpretation, proposed actions, and next review.
Keep denominators, periods and qualifications visible.
Do not invent ROI, causal explanations, approvals or roadmap dates.
Label missing evidence rather than filling it with a claim.
Download the QBR brief and worked adoption example. Replace the fictional figures with the customer's approved data before creating a presentation draft.
The QBR is ready when the customer can see the result, understand its limits and agree on what happens next. The slides should make that conversation easier to have.