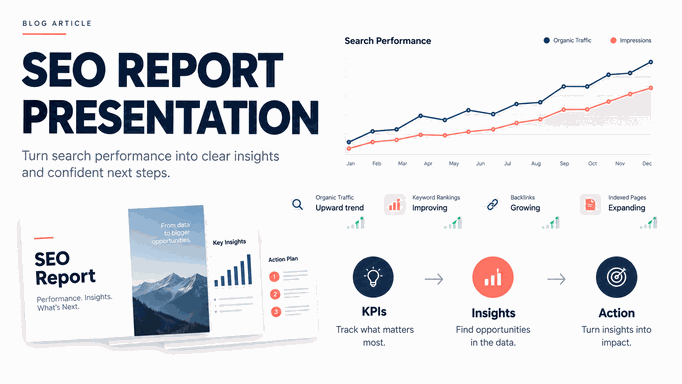
An SEO report presentation should answer three questions in order: what changed, why it matters, and what the team should do next. The template below turns Search Console and analytics exports into a short, decision-ready deck instead of a collection of screenshots.
Use the structure for a monthly SEO report, a client review, or an internal performance meeting. Replace the illustrative values with your own verified data, keep the reporting window visible, and move detailed query or page tables to an appendix.
What an SEO Report Presentation Template Should Do
A useful SEO performance deck is an interpretation layer between raw search data and a decision. It is not a dashboard pasted onto slides. The reader should be able to see the reporting period, the outcome, the evidence behind the outcome, and the next action without opening a spreadsheet.
Google Search Console defines clicks as visits from a Google Search result, impressions as appearances in Search, CTR as clicks divided by impressions, and average position as the average position of the topmost result for the reported impressions. Keep those definitions intact when you rename a metric or design a chart. A percentage without its denominator or date range is not a useful KPI.
The best SEO report template also separates observation from interpretation. “Non-branded clicks fell 8%” is an observation. “The decline is concentrated in two comparison pages after a title change” is an interpretation that needs supporting page and query evidence. “Rewrite the titles this month” is an action with an owner and a review date.
The Core SEO Report Slide Structure
For most monthly reviews, eight to ten slides are enough. The sequence below keeps the executive story short while preserving a path to the evidence.
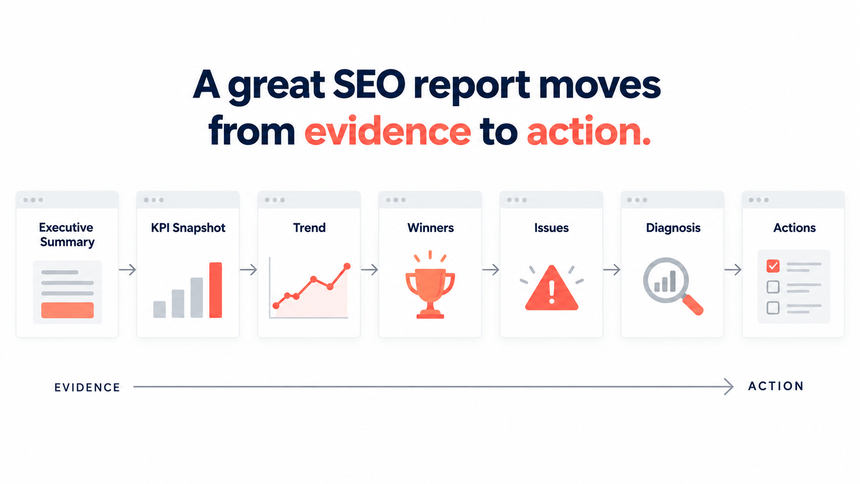
This structure follows the logic used by strong SEO reporting templates: an interpreted summary first, comparable KPIs next, then ranking and landing-page evidence, followed by work completed and a next-month plan. The exact slide count can change, but the order should still reduce the reader’s work.
Choose KPIs That Support a Decision
Start with the business decision, then choose the smallest set of metrics that can support it. A report for an ecommerce team may need organic revenue and assisted conversions. A publisher may prioritize clicks, engaged sessions, and returning users. A local business may need calls or direction requests. Do not add a metric simply because the export contains it.
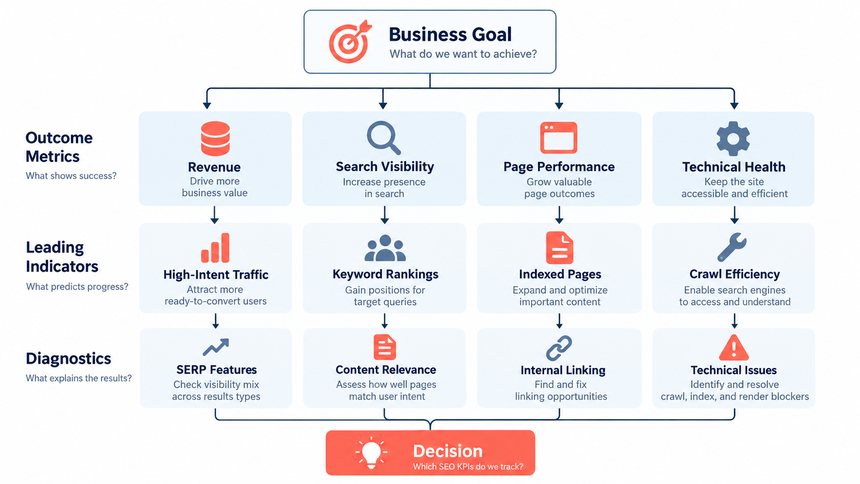
Use a prior-period comparison for every headline KPI. “12,400 clicks” is a status. “12,400 clicks, up 18% month over month, while conversions were flat” gives the meeting a question to investigate. When seasonality matters, add a year-over-year comparison instead of treating a short-term change as a trend.
Turn Search Console Data into Insights
Search Console is most useful when you move from the property view to query and page dimensions. Google recommends filtering a query and then viewing the pages that appeared for it. Use that workflow to connect a keyword group to the URL that actually earned the impression or click.
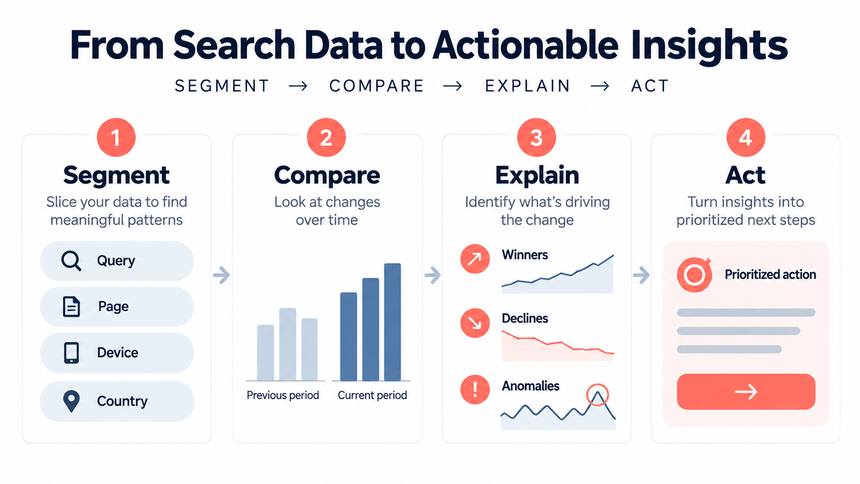
- Set the reporting window. Record the dates, search type, country, device, and any filters. Keep these settings on the slide or in a methodology note.
- Build the baseline. Export clicks, impressions, CTR, and position for the current period and a comparable period. Do not mix a partial month with a complete month.
- Group queries by task. Use labels such as brand, category, comparison, problem, and product rather than a long unfiltered keyword list.
- Map queries to pages. Look for one clear owner page. Several URLs earning impressions for the same intent may indicate a useful cluster, a weak canonical choice, or potential cannibalization. Confirm with page-level data before changing anything.
- Test the explanation. Segment the change by device, country, page type, and search appearance. Choose the segment that changes the recommendation, not the one that makes the chart look dramatic.
- Write the action. Name the page, owner, change, expected signal, and review date. “Improve SEO” is not an action plan.
A helpful title is an assertion, such as “Comparison pages lost clicks after impressions held steady,” rather than a topic label such as “Query performance.” The chart then proves or challenges the assertion.
A Monthly SEO Report Example
Imagine an illustrative SaaS report with these numbers:
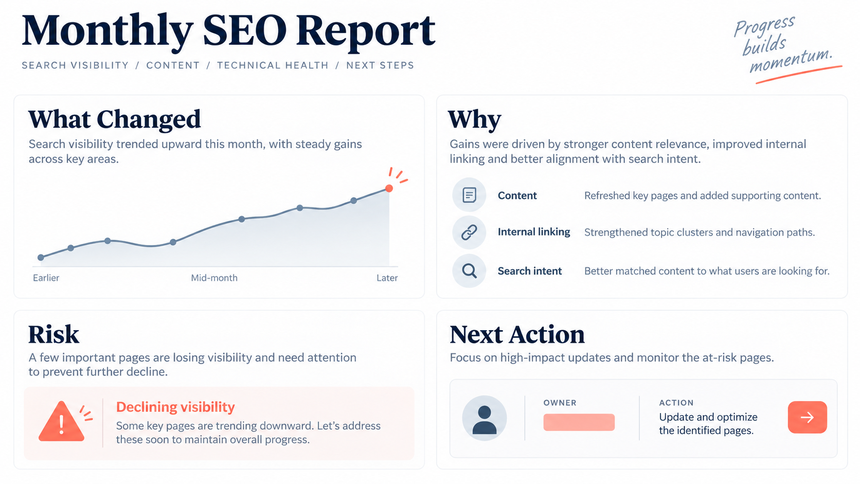
- Organic clicks increased approximately 15% month over month.
- Impressions increased 31%, but CTR fell from 2.4% to 2.1%.
- Three new comparison pages supplied most of the impression growth.
- Conversions were flat. One hypothesis to investigate is whether the new pages’ calls to action meet visitors’ needs.
The weak summary says, “SEO visibility improved.” The decision-ready summary says, “New comparison pages expanded reach, but their CTR and conversion rate are below the site baseline; improve titles and the in-page next step before scaling the cluster.” That statement gives the team a measurement plan: CTR on the affected query group, conversion rate on the landing pages, and a review after the next complete reporting period.
Show the evidence in this order:
- A KPI card comparing clicks, impressions, CTR, and conversions with the prior period.
- A line chart showing when impressions rose and whether clicks followed.
- A page table showing the three comparison URLs and their query groups.
- A short diagnosis slide separating the visibility gain from the conversion gap.
- An action slide with title tests, CTA review, internal links, and a defined owner.
Build the SEO Deck with Presenti AI
Presenti is most useful after the reporting question and evidence are settled. Prepare a structured outline with the reporting window, KPI definitions, assertion titles, source notes, and the requested decision. Then use Text to Presentation to turn that outline into a first slide draft.
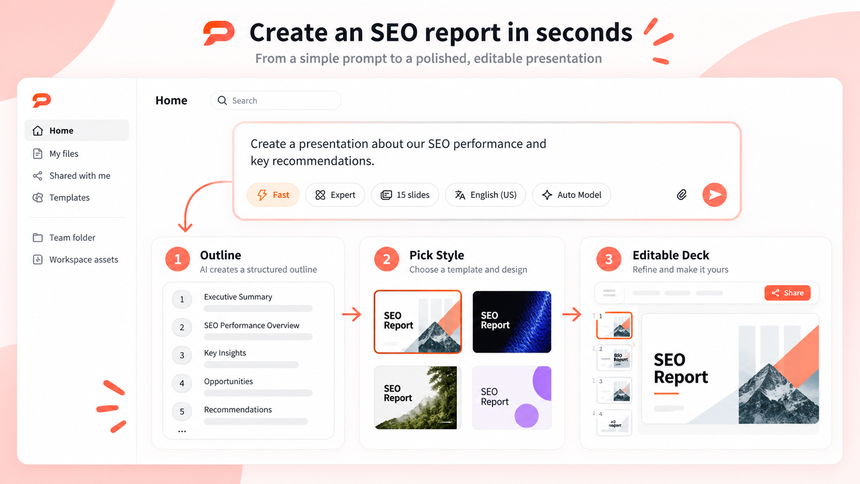
Review the generated deck as a reporting artifact, not as an answer key. Check every number against the approved export, confirm that a chart uses the right denominator, and replace a generic title with the actual finding. If the deck needs a reusable visual system, browse Presenti presentation templates and choose a layout that supports the evidence rather than decorating it. The existing data storytelling workflow is useful when a report needs a stronger context-to-action narrative.
Presenti can speed up the transition from a verified outline to an editable presentation draft. It cannot validate your tracking setup, decide whether a ranking change is causal, or replace a human review of source data. Keep the raw export, methodology note, and final action plan with the deck.
Common SEO Reporting Mistakes
Starting with screenshots
A screenshot preserves a view but rarely explains it. Rebuild the key evidence as a chart or table with a title that states what changed. Keep screenshots in the appendix only when the interface itself is relevant.
Mixing incompatible periods
Do not compare a 28-day window with a calendar month or combine a complete period with partial data. State the dates on every chart that could be forwarded without the rest of the deck.
Treating average position as a fixed rank
Average position is aggregated over impressions and can move when the query mix changes. Use it with clicks, impressions, query groups, and page data. Do not claim that one URL “ranked number three” for every search.
Reporting activity instead of outcomes
“Published four articles” is work completed. It is not evidence that the work achieved its goal. Pair activity with the intended signal and a review date, and keep the claim provisional until the data is available.
Ending without an owner
A recommendation without an owner, due date, and measurement rule is a wish. Make the final slide operational: who will change what, by when, and what result will trigger the next decision?
SEO Report Presentation Checklist
- The reporting window, search type, filters, and comparison period are visible.
- Every headline KPI has a definition, unit, denominator, and source.
- Clicks, impressions, CTR, and position are not presented as interchangeable measures.
- Query groups are connected to the pages that appeared for them.
- The deck separates observation, interpretation, and recommendation.
- Charts use honest scales, readable labels, and a clear baseline.
- Illustrative values, forecasts, and target numbers are labeled as such.
- The action plan names an owner, date, expected signal, and review date.
- The appendix preserves enough detail for a reviewer to reproduce the conclusion.
- Every generated slide has been checked against the original data before sharing.
Frequently Asked Questions
What should an SEO report presentation include?
Include an interpreted executive summary, comparable KPI cards, search visibility trends, query and ranking movers, page performance, a supported diagnosis, work completed, and a prioritized action plan. Put full exports and methodology notes in an appendix.
How long should a monthly SEO report deck be?
Use the fewest slides that let the audience understand and question the decision. Many monthly reviews work in eight to ten slides plus an appendix. A longer deck is justified when the audience needs a deeper audit, not because the export is large.
Should I include Google Analytics and Search Console together?
Use both when the decision depends on the path from search visibility to an on-site outcome. Keep the definitions and attribution rules separate. Search Console describes the search result interaction; analytics describes behavior after the visit.
Can AI write an SEO report?
AI can help organize an approved outline, draft slide titles, and format charts. It should not invent insights, merge incompatible periods, or make causal claims that the source data does not support. Human review remains part of the reporting process.
Bottom Line
A strong SEO report presentation template turns a monthly export into a decision. Lead with what changed, show the evidence that explains it, and finish with an owned action and a review date. Keep definitions, dates, and limitations visible so the deck can be trusted when it is forwarded without the presenter.
When the outline and numbers are ready, try Presenti AI for free, then review every generated slide against your source data before you share the report.