A service-level review should explain what users received, how that compares with the agreed objective, and what the team should do next. A green percentage is not enough. The audience needs to know what was counted, which period it covers, and whether a small number of users had a much worse experience than the headline suggests.
Start with a statement people can question: “The ticket-submission service met its success-rate objective, but one incident generated most of the failures. We recommend investigating that failure path before tightening the target.” Then show the calculation and the affected workflow. That is a more useful opening than a dashboard screenshot with twelve unexplained numbers.
You can turn approved review notes into an editable deck with Presenti’s text-to-presentation tool. Use your monitoring and support systems as the evidence sources. Presenti helps organize and edit the slides; it does not collect the service telemetry or determine whether an SLO was met.

Define the service, the measure, and the period
Give the review a narrow boundary: one user journey, the service that supports it, and the reporting window. “Platform reliability” is too broad if the actual evidence covers only ticket submissions. A successful submission does not demonstrate that sign-in, search, and notifications also worked.
Three terms belong on the first results slide, or in a small glossary beside it. Google’s SRE explanation of service-level objectives distinguishes the measure, the target, and the agreement:
| Term | Meaning | What to show |
|---|---|---|
| SLI: service-level indicator | A quantitative measure of service behavior. | The measured result and how it was calculated. |
| SLO: service-level objective | The target for that measure over a defined period. | The agreed threshold, scope, and time window. |
| SLA: service-level agreement | An agreement that includes consequences when its service commitments are not met. | The applicable agreement and its own measurement terms, if contractual performance is in scope. |
Do not label an internal SLO result “SLA compliance” simply because the percentages look similar. The agreement may have a different service boundary, exclusions, or calculation period. Keep the operational result and the contractual assessment separate; the slide alone does not establish a contractual breach or entitlement to a credit.
Worked example: a ticket-submission service
The following service, records, and numbers are fictional. They illustrate how to build the review; they are not Presenti performance data or a customer case study.
A support platform is reviewing whether customers could submit new tickets. Its agreed success-rate SLO is 99.90% for this fixed 28-day period. The measurement card below belongs next to the result, not in a hidden appendix.
| Field | Definition used in this example |
|---|---|
| User journey | Submit a new support ticket and receive its usable ticket ID. |
| Window | 1 September, 00:00 UTC, up to but not including 29 September, 00:00 UTC: 28 complete days. |
| Eligible event | An authenticated, well-formed production submission attempt admitted by the gateway. Each attempt has its own request ID. |
| Good event | The ticket is stored and the submitting client receives a usable ticket ID. |
| Excluded traffic | Health checks, labeled test traffic, and requests that fail the pre-agreed eligibility rules. These rules were set before the review period. |
| Evidence | A frozen gateway export joined to ticket-service outcomes by request ID; the query version and extraction time accompany the deck. |
| Coverage limit | Failures before a request reaches the gateway are not measured by this SLI. |
The denominator is submission attempts, not customers. A retry creates another attempt under this definition. If one customer makes ten submission attempts in total, the review contains ten events, not ten affected customers. Keep that distinction when writing both the chart label and the speaker notes.
The coverage limit also matters. A broken sign-in page could prevent customers from reaching the gateway while this SLI still looks healthy. Show that gap alongside the result and use separate evidence for the wider journey. Do not improve the percentage by excluding failed requests after the period has ended.
Show the error-budget calculation, not just the color
Google’s guidance on implementing SLOs describes event-based indicators as good events divided by total events. For a percentage target below 100%, the difference gives the allowed proportion of bad events. Here is the arithmetic for our completed example period.
| Quantity | Calculation | Result |
|---|---|---|
| Eligible attempts | Count of in-scope request IDs | 2,000,000 |
| Good attempts | Confirmed successful outcomes | 1,998,600 |
| Bad attempts | 2,000,000 − 1,998,600 | 1,400 |
| Measured success rate | 1,998,600 ÷ 2,000,000 × 100 | 99.93% |
| Allowed bad attempts | 2,000,000 × (1 − 0.9990) | 2,000 |
| Budget consumed | 1,400 ÷ 2,000 × 100 | 70% |
| Unused allowance in this period | 2,000 − 1,400 | 600 attempts |
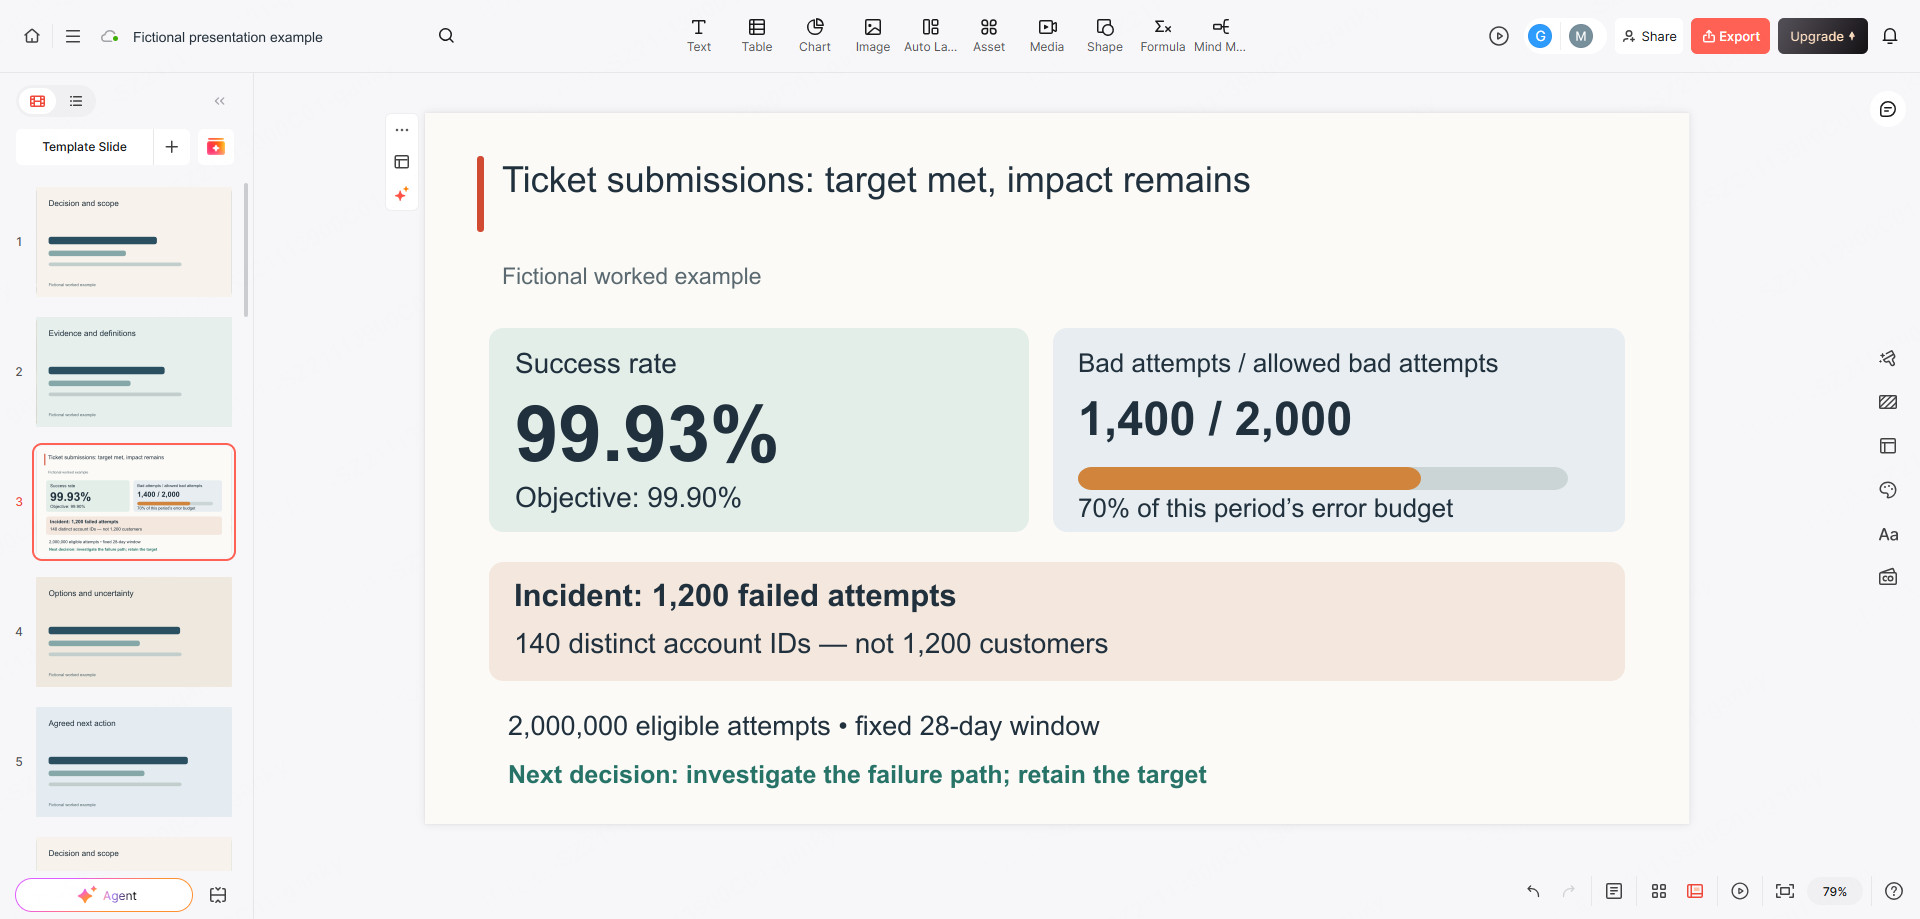
The success-rate objective was met: 99.93% is above 99.90%. The margin is 0.03 percentage points. The team used 70% of the allowed failures, not 70% of all requests.
Label the 600 remaining attempts carefully. They describe the completed reporting period; they are not permission to cause 600 failures next month. A rolling production SLO would need its own current-window calculation. Likewise, an event budget is not a downtime allowance in minutes. A minute with heavy traffic and a minute with little traffic can contribute very different numbers of failed attempts.
Put the full-precision values in the source sheet and use consistent rounding in the deck. If a result is close to the threshold, avoid rounding a miss into an apparent pass. Preserve the query and window with the slide so another person can reproduce the result later.
Explain who was affected by the failures
In the fictional records, one incident accounts for 1,200 of the 1,400 bad attempts. Those 1,200 attempts are associated with 140 distinct account IDs. The incident therefore consumed 60% of the period’s total error budget: 1,200 divided by 2,000. The other 200 failures consumed another 10%.
That gives the impact slide a useful headline: “One incident used most of the error budget and affected 140 accounts.” It does not support “140 people could not work” or “1,200 tickets were lost.” Accounts may have multiple users, repeated attempts may refer to the same intended ticket, and the failure count does not establish whether a ticket was eventually created.
Show the affected workflow next to the count. In this example, customers could not reliably obtain a ticket confirmation during the incident. Support records can help explain what they did next, but do not turn a few support conversations into a claim about every affected account.
A small impact panel can carry three lines:
- Observed: 1,200 failed attempts linked to the incident; 140 distinct account IDs in those records.
- Not yet established: how many intended tickets were abandoned rather than successfully resubmitted.
- Follow-up: reconcile attempts and eventual ticket creation before reporting an abandonment count.
This is why the overall result and user impact belong together. Meeting the objective answers one question. Concentrated disruption to a specific workflow answers another. Neither should erase the other.
Turn the result into a reliability decision
The review is not a contest to select the highest possible target. Ask which action would address the observed problem, what evidence supports it, and what work would be displaced. A proposal to move from 99.90% to 99.99% does not itself improve the service.
For the example, the service owner can compare these options:
| Option | What it addresses | Evidence needed before committing further |
|---|---|---|
| Investigate the concentrated failure path | The incident responsible for 1,200 failed attempts. | A reproducible failure and a test comparing candidate mitigations; do not claim a cause from timing alone. |
| Extend measurement before the gateway | The blind spot between the customer’s browser and the current SLI. | A scoped measurement proposal that explains coverage, data handling, and implementation effort. |
| Tighten the SLO now | A stricter reliability commitment. | Evidence that the new target matches user needs and an agreed plan for the additional reliability work. |
The first two options address specific findings. The third needs a separate decision about expectations and cost. Do not silently lower the target to make the current report green, or raise it merely to make a slide sound ambitious.
If your organization already has an error-budget policy, identify the action it requires and who can approve an exception. If it does not, present a policy proposal as a proposal. A presenter should not invent an automatic release freeze and imply that everyone has already agreed to it.
Build a six-slide review people can use afterward
The main deck can stay compact because the detail is in the evidence pack. Give each slide one job:
- Result and decision: 99.93% success against 99.90%; one concentrated incident; the specific work you want authorized.
- Measurement boundary: the user journey, dates, eligible and good events, source, and coverage gap.
- Budget: the numerator, denominator, allowed failures, and 70% consumption calculation.
- User impact: the affected workflow, 140 observed account IDs, and what remains unknown.
- Options: the competing actions, the evidence each needs, and the work they would displace.
- Decision record: the owner, approved scope, next review point, and evidence expected at that review.
Keep metric exports and query details with the deck, but avoid copying personal customer data into the slides. Use a redacted impact summary for a wider audience. If a change to the definition is proposed, show it as a future version and keep the current result attached to the definition that produced it.
A completed decision record for the fictional meeting might read:
Approve a two-engineer-day investigation of the ticket-confirmation failure path, owned by the service lead. Return with a reproduction, mitigation options, and test evidence; no reduction in future failures is claimed yet. Keep the 99.90% success SLO unchanged. At the next review, also present a scoped proposal for measuring submission failures before the gateway. Any implementation beyond the investigation needs a separate capacity decision.
That record gives the next meeting a concrete starting point. The team will review evidence from a defined piece of work, rather than present the same green percentage and make the same promise again.