A budget variance presentation should explain the gap between planned and actual spending before asking anyone to fix it. Start with the original budget, adjust the relevant costs for the amount of work actually completed, and then show the difference that remains. A higher total is not, by itself, evidence that the team used resources badly.
The worked example below turns a $2,100 cost overrun into two different management questions: $1,400 follows higher activity under the budget's assumptions, while $700 remains to investigate. This is an illustrative cost model, not a customer result. For the broader process of connecting evidence to a recommendation, use the data storytelling workflow for presentations.

Start with a comparable budget and actual result
Imagine an order-fulfillment team reporting one month's costs. The approved budget assumed 1,000 completed orders; the team actually completed 1,200. All figures below refer to the same month, cost categories and definition of a completed order. Costs are in US dollars.
The budget allows $3 of packaging and $4 of handling labor per completed order, plus $2,000 of fixed facility costs. For this example, the orders have the same expected work content, and the facility cost is assumed to remain fixed across 1,000–1,200 orders. The real budget owner must confirm equivalent assumptions before applying this model to another operation.
| Cost category | Original budget | Actual cost |
|---|---|---|
| Packaging | $3,000 | $3,840 |
| Handling labor | $4,000 | $5,160 |
| Facility | $2,000 | $2,100 |
| Total | $9,000 | $11,100 |
A slide showing only $9,000 versus $11,100 reports a valid total difference: actual cost is $2,100 higher, or 23.3% above the original budget. But it omits the 20% increase in completed orders. That missing context changes the discussion.
Before calculating, reconcile timing and scope with the person who owns the accounts. An unpaid invoice, a late posting or a newly included cost category can make two totals incomparable. Do not silently remove a charge because it complicates the story; show the agreed treatment and its source.
Adjust variable costs to actual activity
A flexed budget asks what the original cost assumptions would allow at the actual activity level. It is a comparison, not a retroactive approval of the spending. ACCA's Managing Costs and Finance example makes the important distinction: activity changes the variable-cost allowance, while fixed costs remain unchanged under the stated model.
Here, packaging becomes 1,200 × $3 = $3,600, and handling labor becomes 1,200 × $4 = $4,800. Keep the facility allowance at $2,000. The flexed total is therefore $10,400.
| Cost category | Flexed budget | Actual minus flexed |
|---|---|---|
| Packaging | $3,600 | +$240 |
| Handling labor | $4,800 | +$360 |
| Facility | $2,000 | +$100 |
| Total | $10,400 | +$700 |
Do not multiply the entire $9,000 budget by 1.2. That would produce $10,800 because it incorrectly increases the fixed facility allowance by $400. It would make the unexplained difference look smaller without providing any evidence that the facility budget should change.
The same caution applies in the other direction. A salaried team, a minimum supplier charge or an extra shift may not vary smoothly with order count. Split mixed costs into supported components or show the relevant step change. If the cost behavior is unknown, label the analysis provisional rather than treating every line as a per-order cost.
Show the $2,100 overrun as a bridge
The presentation now has a simple sequence that reconciles exactly:
- $9,000: original budget for 1,000 orders.
- +$1,400: additional allowance for 200 orders at $7 of variable cost per order.
- +$700: actual cost above the flexed allowance.
- $11,100: actual cost for 1,200 orders.
The reconciliation is $9,000 + $1,400 + $700 = $11,100. Use a waterfall chart if the audience needs to see the sequence, or a small table if exact values are more useful. Label the starting and ending totals directly, identify the activity assumption, and explain the sign convention. Do not rely on red and green alone.
A defensible headline is: “Higher order volume accounts for $1,400 of the cost gap under the budget model; $700 remains above the adjusted allowance.” “The team wasted $700” goes beyond the evidence. So does “Growth explains the whole overrun.”
The original $2,100 difference still matters to the person responsible for the spending limit. Keep it visible alongside the adjusted comparison. A flexed budget helps explain performance; it does not erase a funding constraint or amend an approval.
Investigate the remaining difference without inventing a cause
The $240 packaging difference could involve purchase prices, usage, damaged supplies or a change in order composition. The $360 labor difference could involve hours, pay rates or more complex work. The table alone cannot distinguish those explanations.
Ask for the evidence that can separate them. For packaging, compare purchased and used quantities, unit prices and the relevant order types. For labor, compare paid hours, applicable rates and completed work. For the $100 facility difference, identify the actual charge and whether the original fixed-cost assumption still applies.
Give each investigation an owner and a return date, not a premature savings target. “Operations and finance will reconcile packaging usage and prices before Friday's review” is a usable next action. “Reduce packaging waste by $240” assumes the conclusion before the investigation has happened.
If the review reveals that complex orders made up a larger share of the month, revisit the activity model. One average cost per order may no longer be a fair comparison. Present the revised assumption separately, retaining the original approved budget so readers can see what changed.
Build a five-slide budget review around the decision
This sequence keeps the calculation available without making the meeting a tour of the workbook.
| Slide | Message and evidence | Discussion |
|---|---|---|
| 1. Headline | $2,100 over original budget; $700 above the activity-adjusted allowance. | Which difference needs an explanation, a funding decision or both? |
| 2. Activity | 1,200 completed orders versus 1,000 planned; same scope and period. | Is the work sufficiently comparable for a per-order model? |
| 3. Cost bridge | $9,000 + $1,400 + $700 = $11,100. | Do the variable and fixed assumptions still hold? |
| 4. Remaining gaps | Packaging $240, labor $360, facility $100 above flexed allowances. | What records are needed before choosing a remedy? |
| 5. Next action | Named investigation owners, dates and any separate spending decision. | What must be agreed now, and what returns at the next review? |
Keep the account detail and source calculations in an appendix or linked working file. Put the period, currency and cost definition beside the chart, where someone reading a forwarded slide can still find them. Avoid a title such as “Poor cost control” unless the supporting analysis establishes that conclusion.
Turn the checked explanation into a slide draft
After the budget owner has checked the comparison, use Presenti to turn the approved budget brief into slides. Supply the numbers and explanation as text; this workflow does not assume that the product calculates budget variances or maintains a live link to an accounting workbook.
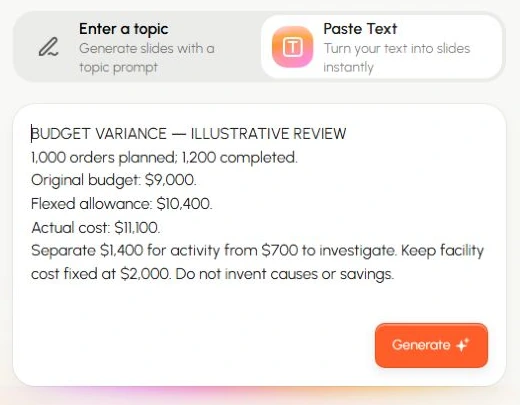
Create a five-slide monthly cost review from this illustrative example. Original budget: 1,000 orders; packaging $3,000, handling labor $4,000, facility $2,000; total $9,000. Actual activity: 1,200 orders. Flexed budget: packaging $3,600, labor $4,800, facility $2,000; total $10,400. Actual costs: $3,840, $5,160 and $2,100; total $11,100. Show the $1,400 activity allowance and $700 remaining difference separately. Preserve the fixed-cost assumption and state that causes remain unconfirmed. End with investigation owners and dates to be supplied, not invented savings or approvals.
Review the generated chart and headline against the same source table. Check that $10,400 is labeled as a flexed budget rather than actual spending, and that the $700 has not become a claimed efficiency loss. When the next month's results arrive, recalculate the comparison before reusing the headline. The slide layout can stay; the explanation must follow the new evidence.