A customer churn presentation should make three things clear: which customers left, how much recurring revenue their departure represents, and what the team has enough evidence to do next. Start with a defined group of customers and a reconciled table. A chart labeled “churn is improving” is not useful if the population or calculation changed between periods.
This guide builds a report from a fictional subscription business. It separates customer losses from revenue losses, keeps new business out of a starting-cohort calculation, and shows how to discuss cancellation reasons without pretending they prove a cause. Once those facts are ready, you can turn the checked findings into an editable presentation draft. The calculations and interpretation belong in the source brief, before slide generation.
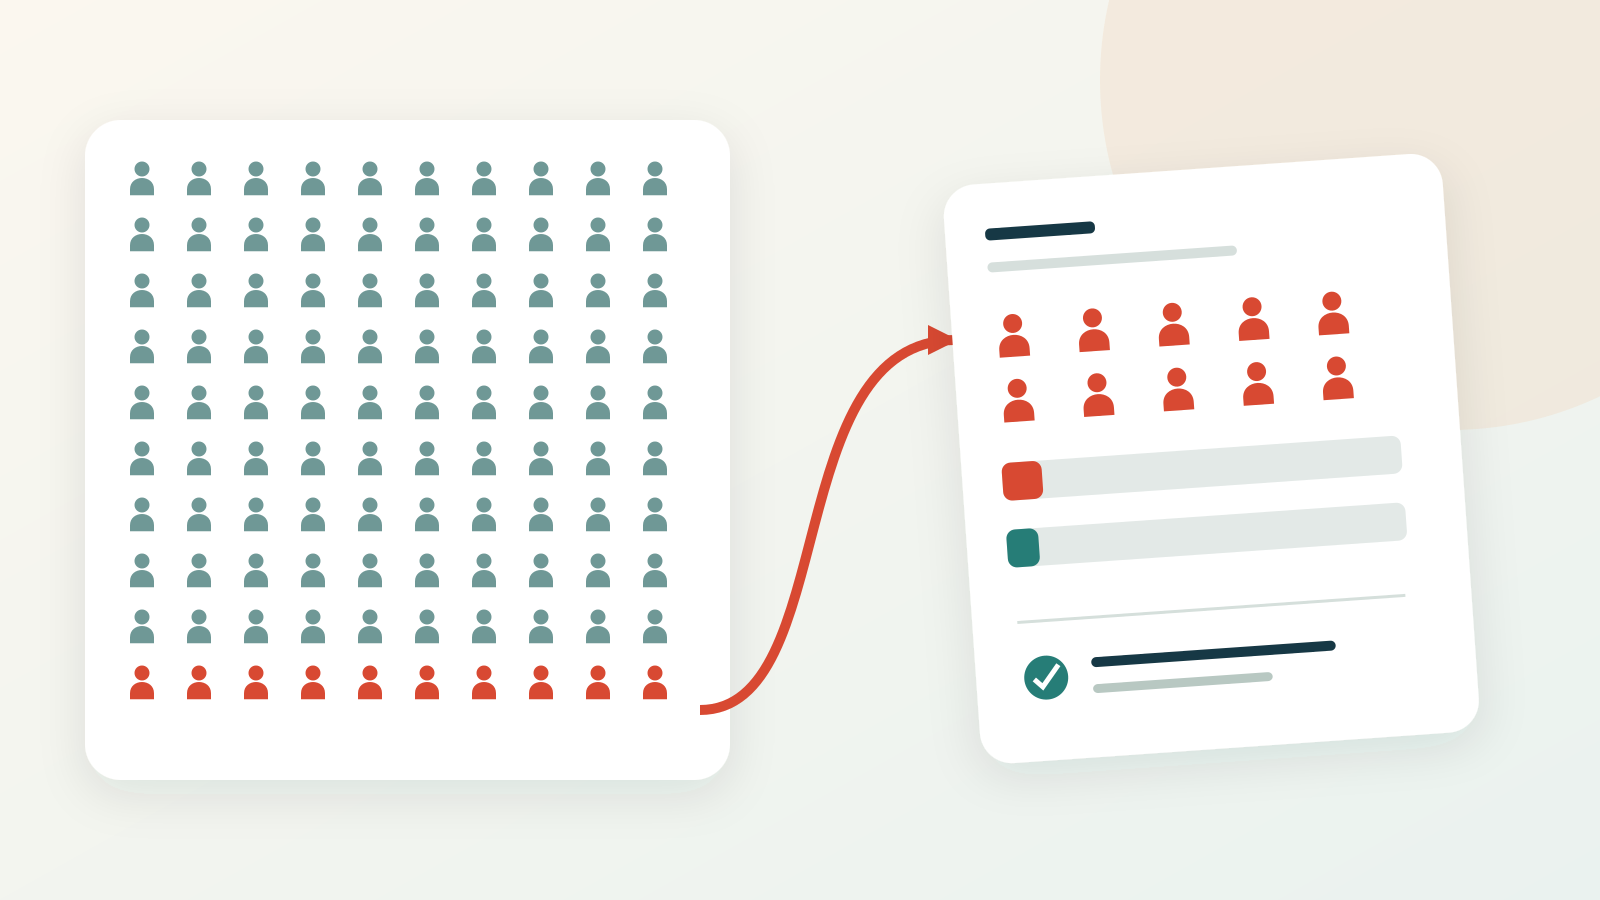
Define the group before you calculate a rate
For this example, the reporting period is September. The business starts the month with 100 paying customer accounts and 50,000 USD in monthly recurring revenue. An account counts as lost if it was in that starting group and has no active paid subscription at the end of the month. There are no reactivations, upgrades, downgrades, currency changes or price changes in this simplified example.
That definition answers questions a slide title cannot: Are you counting accounts or subscriptions? When does a cancellation become a loss? Do unpaid accounts count? Are you examining the starting group or every account active during the period? Agree on those choices with the person responsible for the source data.
Do not assume a billing dashboard uses the same calculation as your report. For example, Stripe's Billing Analytics documentation defines its subscriber churn rate using churned subscribers over a 30-day period divided by starting active subscribers plus new subscribers during that period. It also documents configurable metric definitions. The starting-cohort measure used here deliberately answers a different question: what happened to the customers we already had at the start?
Put the definition beside the first result, not in an appendix nobody sees. “September; accounts active on 1 September; lost by 30 September” is far more informative than “monthly churn.”
Reconcile customer losses and revenue losses separately
Suppose the source roster contains two groups. The table summarizes the records; the actual working file should still identify each account so the totals can be traced back.
| Starting group | Accounts at start | Starting monthly revenue | Accounts lost | Monthly revenue from lost accounts |
|---|---|---|---|---|
| Smaller accounts | 80 | 24,000 USD | 8 | 2,400 USD |
| Larger accounts | 20 | 26,000 USD | 2 | 1,600 USD |
| Total | 100 | 50,000 USD | 10 | 4,000 USD |
Starting-cohort customer churn is 10 ÷ 100 = 10%. The ten departing accounts represent 4,000 ÷ 50,000 = 8% of starting monthly recurring revenue. The two percentages differ because accounts do not all pay the same amount.
The surviving starting group contains 90 accounts and 46,000 USD of monthly recurring revenue. Check both reconciliations: 100 − 10 = 90, and 50,000 − 4,000 = 46,000. If either fails, resolve missing records, duplicate accounts or other revenue movements before explaining the result.
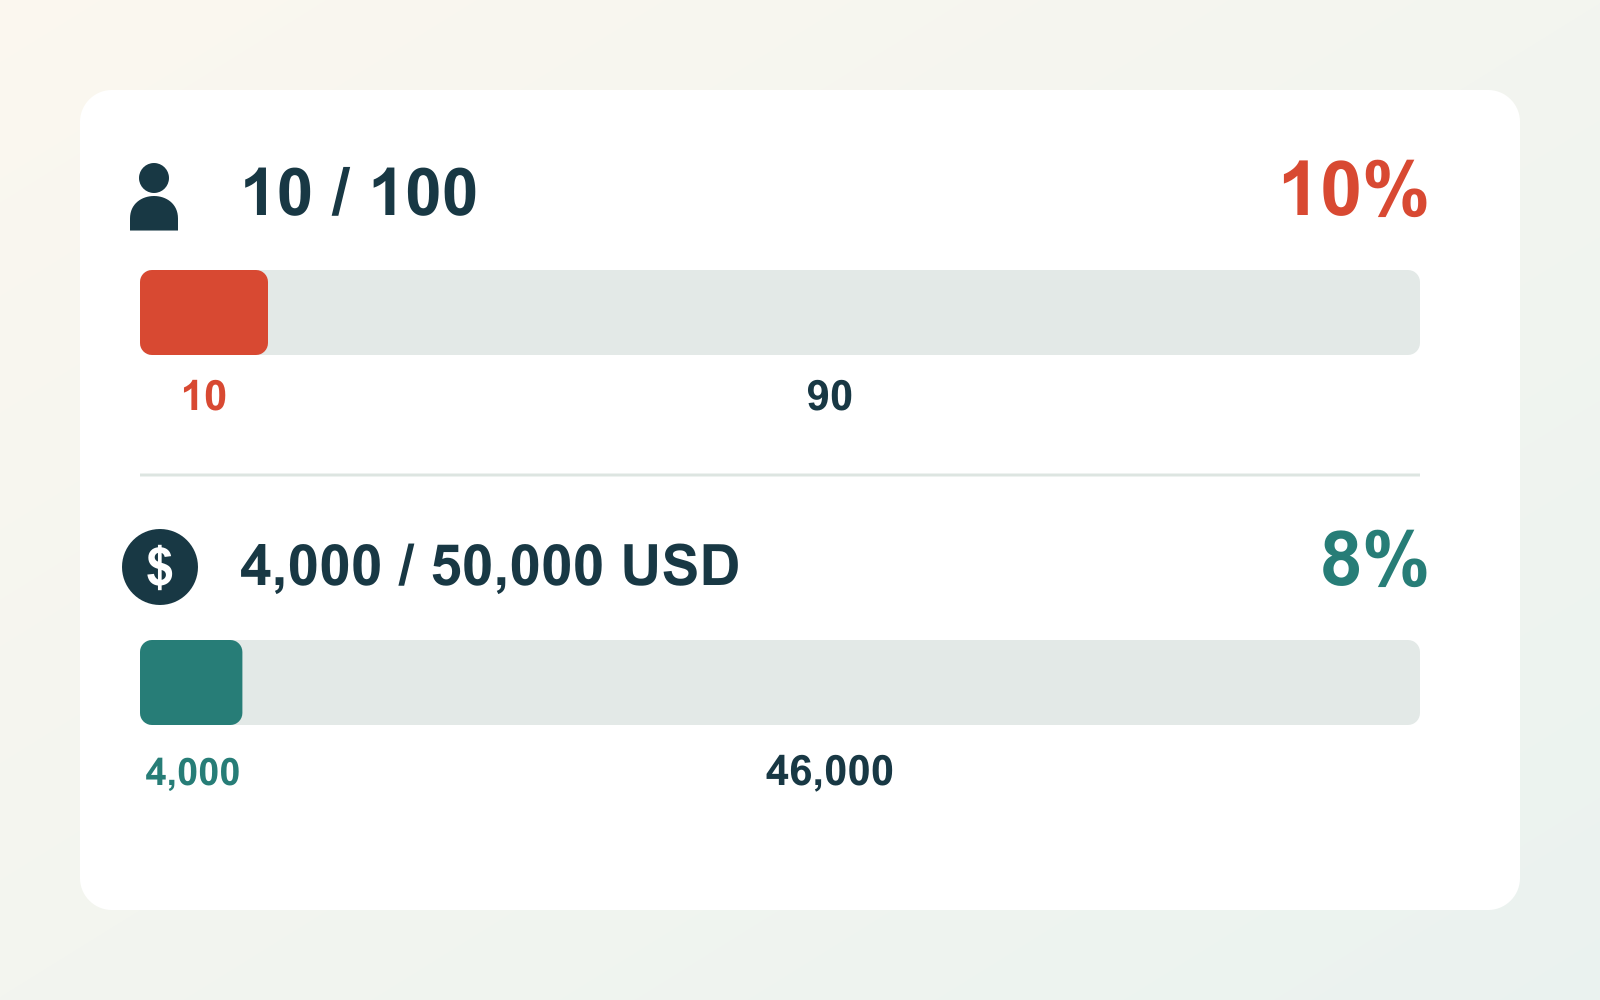
A useful opening headline is “Ten of our 100 starting customers left, taking 8% of starting recurring revenue.” It tells the audience what happened without claiming that the rate is good, bad or caused by one particular issue. A judgment about performance needs a comparable prior period, an agreed target or another relevant basis.
Keep new business visible without hiding the losses
Now add 15 new accounts during September, contributing 6,000 USD in monthly recurring revenue. None of them leaves during the month. The business ends with 105 accounts and 52,000 USD in monthly recurring revenue.
- Accounts: 100 starting − 10 lost + 15 new = 105 ending.
- Monthly recurring revenue: 50,000 starting − 4,000 lost + 6,000 new = 52,000 USD ending.
Growth and churn can coexist. The total account count rose by five, but ten members of the starting group left. A slide that only shows 100 becoming 105 conceals the retention question. A slide that only shows the ten losses conceals the acquisition contribution.
Use a short bridge for the overall movement, then a separate view for the starting cohort. Do not change the denominator to 105 merely because that is the final account count. If your organization reports a different approved churn measure, show it with its own definition rather than relabeling this example's 10%.
Revenue also needs precise wording. The 4,000 USD is lost monthly recurring revenue in this example. It is not automatically lost cash, recognized revenue, annual revenue or profit. Multiplying it by twelve would introduce a projection about the future, not reveal another observed September result.
Separate cancellation events from customers lost at month-end
Use a separate small example when the records include returns or plan reductions. The 100-account example above deliberately excludes them. Here, four accounts start September with one active paid subscription each, worth 100 USD in monthly recurring revenue per account. There are no new customers, price changes or currency movements. The dates below are when service actually ends or resumes, not dates when someone requests a future cancellation.
| Account | At 1 September | Effective change during the month | At 30 September |
|---|---|---|---|
| A | Active; 100 | Subscription ends on 10 September and resumes on 20 September under the same account ID. | Active; 100 |
| B | Active; 100 | Subscription ends on 12 September and does not resume. | No active paid subscription; 0 |
| C | Active; 100 | Plan is reduced to 70; the paid subscription remains active. | Active; 70 |
| D | Active; 100 | No change. | Active; 100 |
The event log contains two effective cancellations, A and B. Under this article's month-end definition, however, only B is a lost starting account. A is active again at the endpoint, C remains a paying account despite its smaller plan, and D is unchanged. Starting-cohort customer churn is therefore 1 ÷ 4 = 25%, with three accounts remaining. Counting both cancellation events as endpoint losses would answer a different question.
The revenue bridge has two distinct reductions: 100 USD from the lost account B and 30 USD from the retained account C. Starting MRR of 400 becomes 400 − 100 − 30 = 270 USD. The cohort's net MRR decline is 130 ÷ 400 = 32.5%; it is not all revenue lost through customer departure. A's temporary loss and restoration offset in this start-to-end comparison. Its return must not also appear as a new customer or a second 100 USD of ending MRR.
For a slide, use a headline such as “Two cancellation events, one customer lost at month-end.” Keep the four-row timeline in the supporting material, and show the 100 USD departure loss separately from the 30 USD contraction. The monthly endpoint report does not describe how long A was inactive or what cash was collected. Those questions require their own records; the chosen definition should remain visible so the audience does not mistake one measure for another.
Choose a segment that changes the question
The smaller-account group lost eight of 80 accounts; the larger-account group lost two of 20. Both customer churn rates are 10%. Saying “smaller customers churn more” because eight is greater than two would confuse a count with a rate.
The revenue view is different. Smaller accounts lost 2,400 of 24,000 USD, or 10%. Larger accounts lost 1,600 of 26,000 USD, approximately 6.2%. That difference describes this month's mix of departing accounts. It does not establish that larger customers are inherently more loyal.
Choose a segment because it changes a practical question: onboarding stage, contract type, product use or service experience may suggest different investigations. Keep the original counts beside the rates. Two departures in a small group should not become an elaborate trend story without more evidence.
For a review with one customer, the job is different: connect that customer's agreed goal with observed progress and next actions. The customer-success QBR example shows that narrower conversation. A portfolio churn report should not pretend to know each account's motivation from a summary percentage.
Separate recorded reasons from causes
Imagine the cancellation records contain four “too expensive” selections, three “missing capability” selections, one business closure and two blank responses. Present those as ten recorded responses, including the missing ones. Do not redistribute the blanks or state that 40% of all customers consider the product too expensive.
A selected reason is useful evidence of what a departing customer reported. It is not a controlled explanation of why the departure happened. “Too expensive” might reflect price, low use, a budget cut or an unfavorable comparison with another option. Follow-up can clarify the distinction.
Build the discussion around a small number of answerable questions:
- For the four price-related departures, what use and account history can the team lawfully review?
- Do the three capability requests describe the same missing task, or unrelated needs?
- Can the two customers with no recorded reason be approached through an appropriate existing contact route?
The next slide should name an investigation and an owner, not promise a retention improvement. For example: “Customer success will review the four price-related cases with the account owners and bring back a documented explanation of the commonalities.” Discounting every account would be a much larger intervention than the evidence supports.
Build the report around the decision
The report can be short without being vague. Open with the ten losses and their revenue share. Follow with the start-to-end bridge so the audience sees how acquisition and retention interact. Use the segment comparison only if it changes the investigation. End with the specific evidence the team needs next and who will collect it.
A single slide should not contain the full account roster. Keep identifiable customer records in the approved working location. Use aggregate figures in the presentation unless individual account details are necessary and authorized for that audience.
Here is a source brief you can adapt:
Create a presentation for a customer-success review. Use only the supplied fictional September data: 100 starting paying accounts, 50,000 USD starting monthly recurring revenue, ten starting accounts lost, and 4,000 USD recurring revenue associated with those losses. Fifteen new accounts add 6,000 USD; ending totals are 105 accounts and 52,000 USD. Define the starting-cohort measure before showing 10% customer churn and 8% cancellation-related revenue loss. Keep recorded cancellation reasons separate from causal explanations. Finish with proposed investigations, not promised improvements.
Presenti can organize a prepared text brief into an editable slide draft. Compare every generated number and headline with the table, and replace any invented explanation. Keep the cohort definition on the result slide when you refine the layout. A good churn presentation makes the next conversation more precise; it does not make an uncertain explanation sound certain.