An experiment readout should let the room answer three questions: was the comparison trustworthy, how large could the effect reasonably be, and what decision follows? A higher conversion rate alone does not answer all three. Put the recommendation beside the result, then show the design and calculation that support it.
This guide uses one fictional A/B test throughout: a booking software team tries a shorter setup flow. Every count, result, and decision below is constructed for teaching, not a Presenti test or customer outcome. The observed improvement looks attractive, but it does not meet the team's stated release rule.
Once the analysis is approved, you can use Presenti's text-to-presentation workflow to turn the readout outline into an editable slide draft. Supply the approved figures and their qualifications together; the slide draft is a communication aid, not a substitute for the experiment analysis.

State the decision and the test before showing a chart
The fictional team wants more new users to finish setup. Its proposed change removes two optional questions from onboarding. The hypothesis is that this reduces friction and increases the proportion of eligible new users who complete setup within seven days. The decision is whether to replace the existing flow for all eligible new users—not whether the shorter flow is visually preferable.
| Item | Definition used in this example |
|---|---|
| Population | New users eligible for the setup flow; internal test accounts excluded before assignment |
| Randomization unit | One user, identified consistently across visits; repeat visits keep the original assignment |
| Comparison | Existing flow versus shortened flow, running concurrently with a planned 1:1 allocation |
| Primary outcome | At least one recorded setup completion within seven days of assignment, counted once per user |
| Observation period | Recruitment on days 1–14; final readout after the last recruited user has a full seven-day window |
| Support guardrail | At least one setup-related support contact within the same seven-day window, counted once per user |
Random assignment matters because users do not choose which version they receive. NIST's explanation of a completely randomized design describes assigning treatments to experimental units at random. A before-and-after comparison, or a comparison of people who opted into a new flow, would need a different account of bias and would not justify the same causal language.
For this example, the team agreed on a simplified release rule before reading the results: the completion estimate must improve by at least 2 percentage points, its two-sided 95% confidence interval must be entirely above zero, and the upper bound for the support-contact increase must stay below 1 percentage point. These thresholds illustrate a decision policy; they are not universal standards for A/B tests. A real plan also needs an appropriate sample-size calculation and an analysis method agreed before results are inspected.
Keep the assigned users in the denominator
Show counts before percentages. In the fictional data, each group contains 2,000 assigned users. A user who abandons setup remains in the denominator. Dividing by people who reached the final setup step would exclude precisely the behavior the shorter flow is meant to change.
| Measure | Existing flow | Shortened flow |
|---|---|---|
| Assigned eligible users | 2,000 | 2,000 |
| Users who completed setup | 800 | 860 |
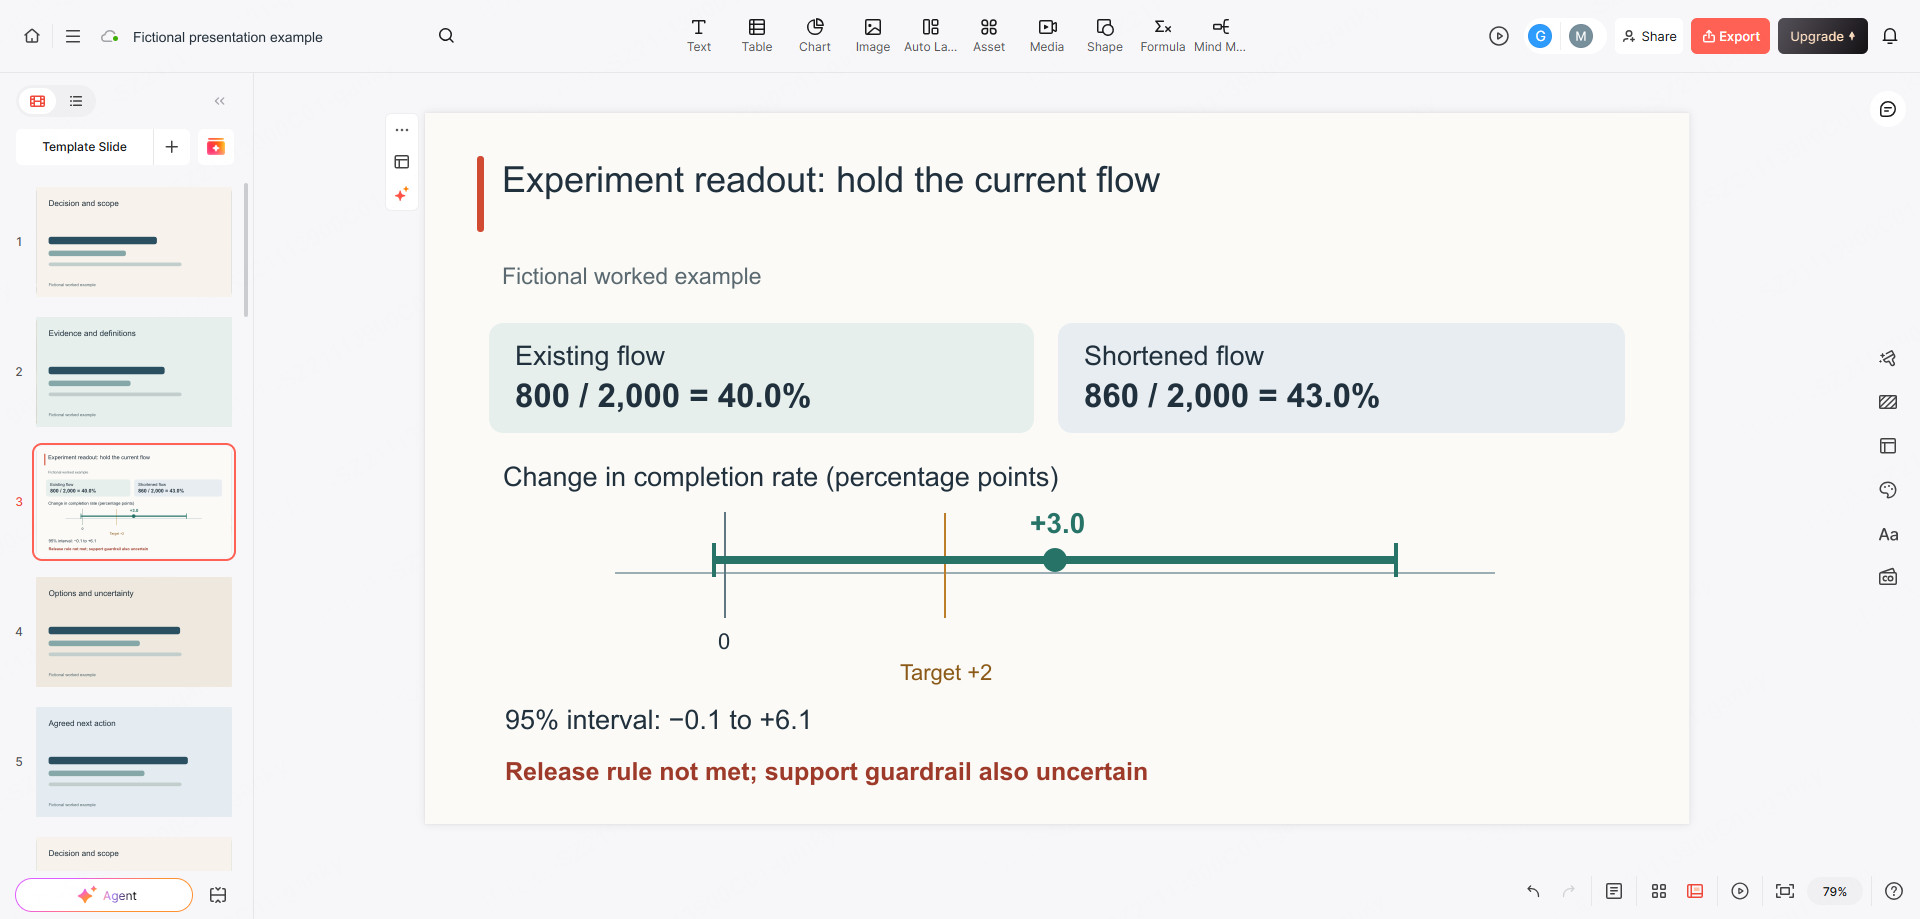
| Completion rate | 800 / 2,000 = 40.0% | 860 / 2,000 = 43.0% |
| Users with a setup-related support contact | 40 | 44 |
| Support-contact rate | 40 / 2,000 = 2.0% | 44 / 2,000 = 2.2% |
The example assumes reliable event capture, no missing outcome records, and independent observations. In a real readout, an absent completion event can mean non-completion only if the measurement system was working. An outage, an untracked device, or a broken identity join is not automatically a zero. If outcome capture differs between variants, resolve that problem before interpreting the rate difference.
Report assignment and exclusion checks alongside this table. Microsoft's research on sample ratio mismatch explains why an unexpected allocation split can warn of experiment data problems. The equal totals here are convenient for teaching; equal group sizes do not prove that assignment, logging, or eligibility rules were correct. Nor should you remove users after assignment merely because they did not engage.
Show the absolute change and its uncertainty
The completion result can be described in two mathematically correct ways: 43.0% minus 40.0% is a 3.0 percentage-point increase, while 3.0 divided by 40.0 is a 7.5% relative increase. Lead with percentage points and show the original rates. A headline reading only “up 7.5%” hides the starting point and is easily mistaken for a 7.5-point gain.
For an illustrative calculation, use the normal-approximation interval for two independent proportions described in Penn State's lesson on comparing population parameters. The estimated standard error is the square root of [0.43 × 0.57 / 2,000 + 0.40 × 0.60 / 2,000], approximately 0.01557. The difference, 0.03, plus or minus 1.96 times that standard error gives an approximate 95% interval of −0.1 to +6.1 percentage points after rounding.
This calculation fits the deliberately simple example: independent binary outcomes with ample successes and failures in both arms. It is not a plug-in formula for repeated sessions, cluster-randomized accounts, rare events, or a sequential design. Use the interval produced by the approved analysis for your actual experiment.
| Outcome | Estimated change | Approximate 95% interval | Decision implication |
|---|---|---|---|
| Setup completion | +3.0 percentage points | −0.1 to +6.1 points | Point estimate exceeds +2 points, but the interval includes zero; the release rule is not met |
| Support contact | +0.2 percentage points | −0.7 to +1.1 points | The upper bound exceeds the allowed +1 point increase; the guardrail has not cleared its rule |
For the main chart, plot the completion difference as a dot at +3.0, an interval from −0.1 to +6.1, a zero reference line, and a separate +2-point practical target. Label the axis “Change in completion rate, percentage points.” Do not plot 43% as the effect or use a truncated pair of bars to make a small difference look enormous.
An interval that crosses zero does not prove there is no effect. Here, both little or no improvement and a worthwhile improvement remain compatible with the calculation. Conversely, a positive point estimate does not establish a positive effect. The support result also does not establish “no extra burden”: its uncertainty extends beyond the team's stated tolerance.
Resolve the disagreement instead of hiding it in an appendix
Imagine three responses to the result. Marketing wants to announce “7.5% better onboarding.” An analyst says the experiment found no effect. The product manager proposes leaving the test running until it becomes significant. The readout should separate the legitimate concern behind each response from the conclusion the data supports.
| Position | What to acknowledge | What the decision slide should say |
|---|---|---|
| “The relative gain is worth shipping.” | The observed direction and size are encouraging | Observed completion rose from 40% to 43%; uncertainty and the support rule prevent broad release under this plan |
| “The change does nothing.” | The result did not meet the evidence threshold | The result is inconclusive for the release decision, not proof of equivalence |
| “Keep collecting until the result passes.” | More information might be valuable | Close this fixed-horizon analysis as planned; have the analyst specify a justified follow-up design rather than an improvised stopping rule |
Continuous monitoring is possible with an appropriate method, but it is not the same as repeatedly applying an ordinary fixed-horizon decision rule. Microsoft Research's work on proper stopping rules explains why the analysis and stopping policy must be designed together.
The same restraint applies to subgroups. If mobile users appear to benefit more, identify whether that comparison was planned and how many cuts were examined. An exploratory slice can motivate a follow-up hypothesis; it should not silently replace the primary outcome because it produces a more favorable headline.
Build a six-slide readout from the approved analysis
Use the following structure as a working template. Each slide has a different job. The first gives the recommendation; later slides make it possible to challenge that recommendation without searching a spreadsheet during the meeting.
| Slide | Example title | What belongs on it |
|---|---|---|
| 1. Decision | Do not replace the existing setup flow yet | +3.0-point observed gain; release and support criteria not met; decision requested from the product owner |
| 2. Test design | One user, one assignment, seven days of follow-up | Eligibility, concurrent control, allocation, outcome definition, recruitment and follow-up windows |
| 3. Data validity | The denominator is every assigned eligible user | 2,000 per arm, exclusions, logging checks, allocation diagnostics, and any unresolved measurement issue |
| 4. Primary result | The observed gain is promising but uncertain | 800/2,000 versus 860/2,000; absolute effect, interval, zero line, practical target |
| 5. Guardrail and limits | Support impact remains uncertain | 40 versus 44 users contacting support, the interval, the tolerance, and the experiment's population limits |
| 6. Recorded action | Retain the current flow; define the next test | Product owner accepts the decision; analyst proposes the follow-up design; support lead reviews the removed questions before another test |
Keep the underlying analysis, metric definitions, and assignment diagnostics attached to the readout as supporting material. A slide need not display every row, but someone should be able to trace each headline number to the approved analysis version. When drafting with AI, include “fictional worked example,” both denominators, both intervals, and the release rule in the input. Review the resulting slide text for omitted negatives, changed units, or an invented verdict.
Record the action this result actually supports
For this fictional test, the meeting record is: retain the existing setup flow; do not claim a proven completion improvement or cleared support guardrail; ask the analyst and support lead to propose the next study before a new launch decision. A follow-up might test revised guidance or be designed to resolve a smaller effect, but its question, sample size, measurement, and stopping rule must be settled before new outcomes are examined.
The readout has done its job when the team can explain why it is taking that action. A persuasive experiment presentation does not make an uncertain result sound certain. It makes the evidence, the business threshold, and the unresolved choice visible on the same page.