A Pareto chart helps an audience see which categories account for most of a measured total. Put the categories in descending order, keep one measurement across every bar, and add a cumulative percentage line when it helps explain the concentration. The useful presentation is the one that turns that pattern into a defensible next action.
For example, “Login and billing account for 60% of requests” is a finding. “Fixing login and billing will remove 60% of requests” is a prediction, and the chart alone cannot support it. This guide carries one small dataset from classification to the chart, the slide headline and the decision.
If the analysis is already in a PowerPoint draft, you can use Presenti to refine the slide layout, then check the labels, scales and numerical meaning after any change. Calculate the data first; an attractive chart does not validate its inputs.
Choose the total before drawing the bars
Decide what one observation means. A request, a customer, a fault and a minute of work are different units. A customer can submit several requests, and one request can involve several problems. Mixing those counts produces a chart that looks plausible but answers no clear question.
For this fictional help-desk example, the unit is one closed support request. The team assigns exactly one primary category to each of 200 requests from a four-week period. A billing request that also mentions difficulty signing in stays in the billing category if billing was the primary reason for contact. That rule is stated before counting and applied consistently.
The scope note for the slide is short: “200 closed requests, four-week example period; one primary category per request.” It establishes the denominator without filling the slide with process detail. It also prevents a reader from mistaking the figures for unique customers or all incidents.
Multiple labels are appropriate for some analyses, but then the total is label assignments, or the percentages can overlap. Say which convention you use. Do not show an overlapping set of request percentages as if it were a partition of 100%.
Calculate each share and the running total
The ASQ description of Pareto charts places larger category measurements first and describes a cumulative percentage line as an optional addition. Here the line is useful because the presentation asks how much of the workload the first few categories represent.
| Primary category | Requests | Share | Cumulative share |
|---|---|---|---|
| Login | 72 | 36% | 36% |
| Billing | 48 | 24% | 60% |
| Setup | 32 | 16% | 76% |
| Permissions | 24 | 12% | 88% |
| Export | 16 | 8% | 96% |
| Other | 8 | 4% | 100% |
Each share is the category count divided by 200. Login is 72 ÷ 200 = 36%. Billing adds 48 requests, so the second cumulative value is (72 + 48) ÷ 200 = 60%. Continue using the unrounded counts, rather than adding percentages that have already been rounded.
The third category takes the total to 76%; the fourth takes it to 88%. An 80% guide line would cross between the third and fourth categories. It would not show that exactly three categories produce 80%, and it would not make the first four categories equally important.
There are six displayed categories here. The first two represent one-third of the categories and 60% of requests. The data do not follow an exact “20% causes 80%” split. There is no reason to alter categories or the chart scale to manufacture that familiar phrase.
Make the count and percentage scales agree
Use bars for counts and a visually distinct line for cumulative share. Label the left axis “Requests” and the right axis “Cumulative share.” A reader should be able to identify the two measures without decoding a distant legend.
For this combined chart, set the left scale from 0 to the total, 200, and the right scale from 0% to 100%. That makes 100 requests align with 50%. The cumulative line then has an interpretable relationship to the bars. If your charting tool chooses the scales independently, correct them instead of accepting the default.
The tallest bar is 72, so it occupies only 36% of this aligned plot height. That is expected. Show the bar values directly and give the plot enough space; do not truncate the bar axis to make the columns look more dramatic. A horizontal ranked bar chart with a separate cumulative table is an alternative if the dual-axis version is too crowded.
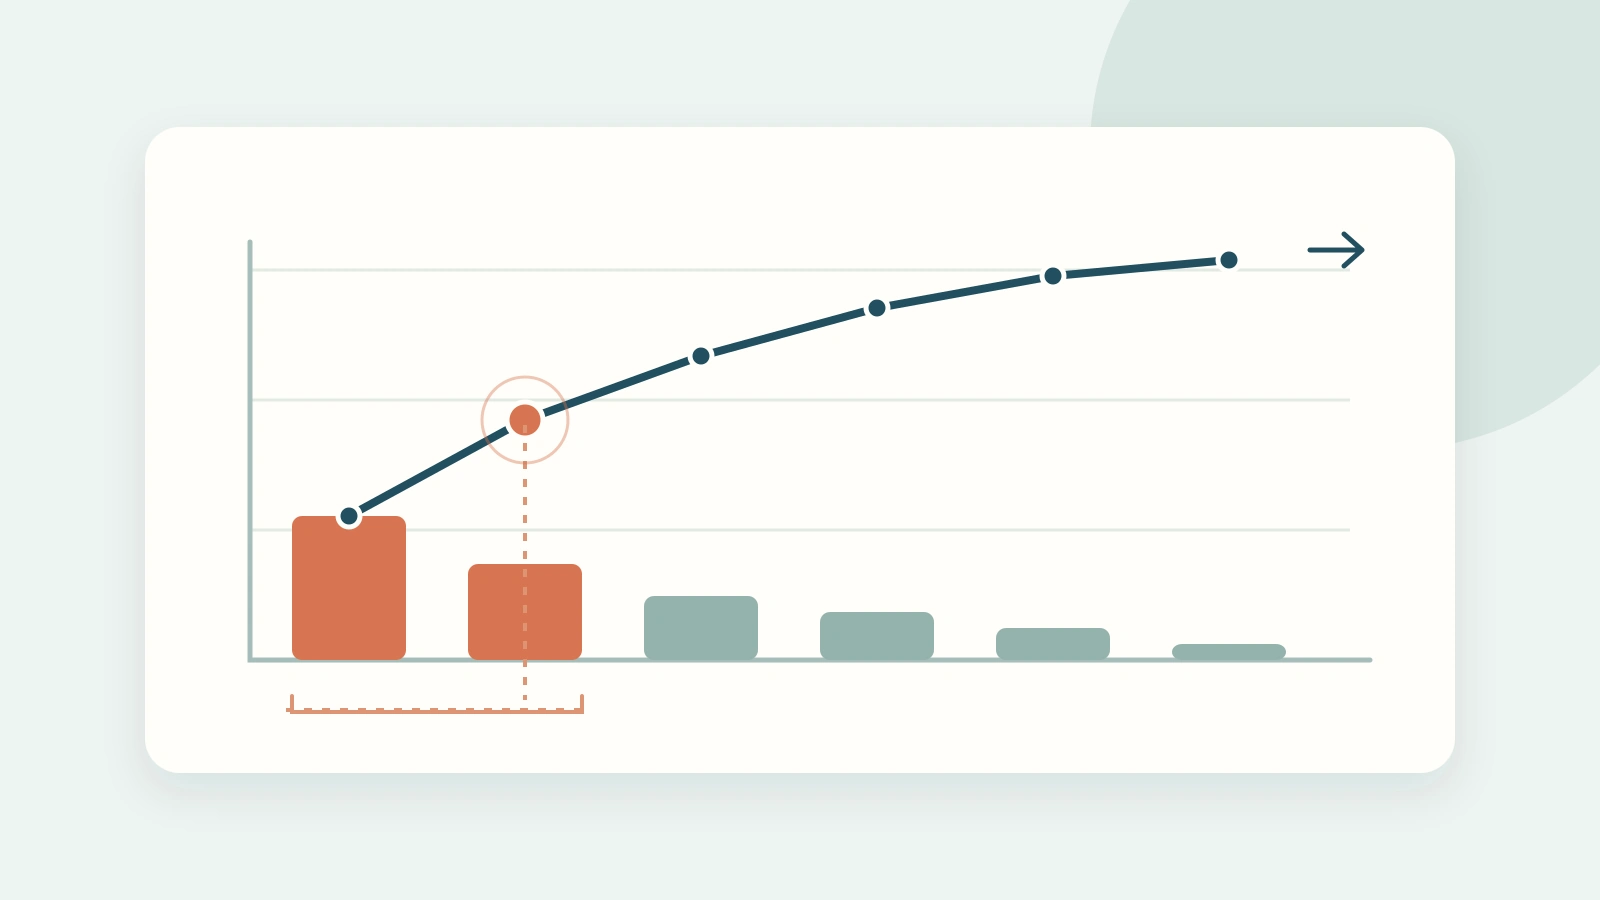
Keep the six category labels short. Highlight Login and Billing together when the headline discusses the first two categories; let the remaining bars use a quieter color. Mark the 60% cumulative point. Highlighting all bars in different bright colors would distract from the concentration the audience needs to notice.
The body chart uses the example table above. Its bars and cumulative values describe exactly the same 200 requests; the line is not a trend over time.

Turn the pattern into a decision without claiming causation
A useful slide could carry this headline: Login and billing account for 60% of requests; investigate their repeat triggers first. Below the chart, add a small action statement: “Review request notes in both categories and distinguish preventable confusion from faults needing a product fix.”
That action follows from the chart while leaving room for investigation. “Login” is a category, not a root cause. The requests could involve forgotten passwords, invitation links, account setup or a service interruption. Different causes may require different owners and remedies.
A short spoken explanation can be specific: “We grouped 200 closed requests by their main reason for contact. Login contributed 72 and billing contributed 48. Together they were 120 requests, or 60%. We propose examining the repeated triggers within those two categories before choosing a fix.”
Notice what this explanation does not claim. It does not say the team can eliminate all 120 requests, that those requests are the most expensive, or that the same mix will recur next month. Those would need additional evidence. For a broader workflow that starts with the underlying complaints, the customer complaint analysis presentation guide covers the decisions around the chart.
Frequency is not effort or severity
Suppose the fictional team measures handling time as well. Login requests average one minute, while billing requests average ten minutes. The totals are then 72 minutes for login and 480 minutes for billing. Billing ranks first on effort even though login ranks first on count.
You cannot calculate a complete effort-based Pareto chart from those two averages alone. Collect comparable time totals for all six categories, then sort those totals afresh. Adding a “minutes” line to the existing request chart would mix units and would no longer be a cumulative request share.
The two views answer different questions. Use request count when the question is how common each contact type is. Use handling time when the question is where support capacity goes. Use a separate severity assessment when a rare event carries consequences that should not be averaged away. A low-frequency issue can require immediate attention regardless of its place in the ranking.
If categories have different exposure, counts may be misleading for another reason. A feature used by 10,000 accounts has more opportunities to generate requests than a feature used by 100. A rate per active account may be appropriate for a reliability comparison, but rates with different denominators cannot simply be added into a cumulative 100% line. Keep that analysis separate and explain the denominator.
Compare periods without hiding a change in the total
After an intervention, compare both counts and shares over comparable periods. Imagine login falls from 72 of 200 requests to 50 of 100. Its share rises from 36% to 50%, while its count falls by 22. Reporting only “login rose to half of requests” would conceal the decline in volume.
Neither number by itself proves the intervention worked. Check whether the periods had comparable usage, the category rules stayed the same and the service changed in other ways. Keep the comparison honest: “Fewer login requests; larger share of a smaller total” is a more accurate headline than “Login problems worsened.”
For two separate Pareto charts, re-sort each period by its own values and keep category colors consistent. For a direct category-by-category comparison, a grouped bar chart with a fixed order may be easier to read. Choose the form that answers the comparison question instead of forcing every follow-up into a Pareto format.
Reuse this brief for your own slide
Question: Which categories account for the largest share of [one measured total]?
Scope: [population], [period], [unit], [category assignment rule].
Finding: [first categories] account for [count] of [total], or [share].
Next action: Examine [specific underlying evidence] to decide [a bounded action].
Boundary: This chart ranks [frequency, effort or cost]; it does not establish [causation, severity or another unmeasured outcome].
Fill this brief from your own data before building the slide. Keep the source table with the presentation so that a colleague can reproduce the total and cumulative line. Once the arithmetic and conclusion agree, the slide needs only a clear headline, the chart, a compact scope note and the action the audience is being asked to support.