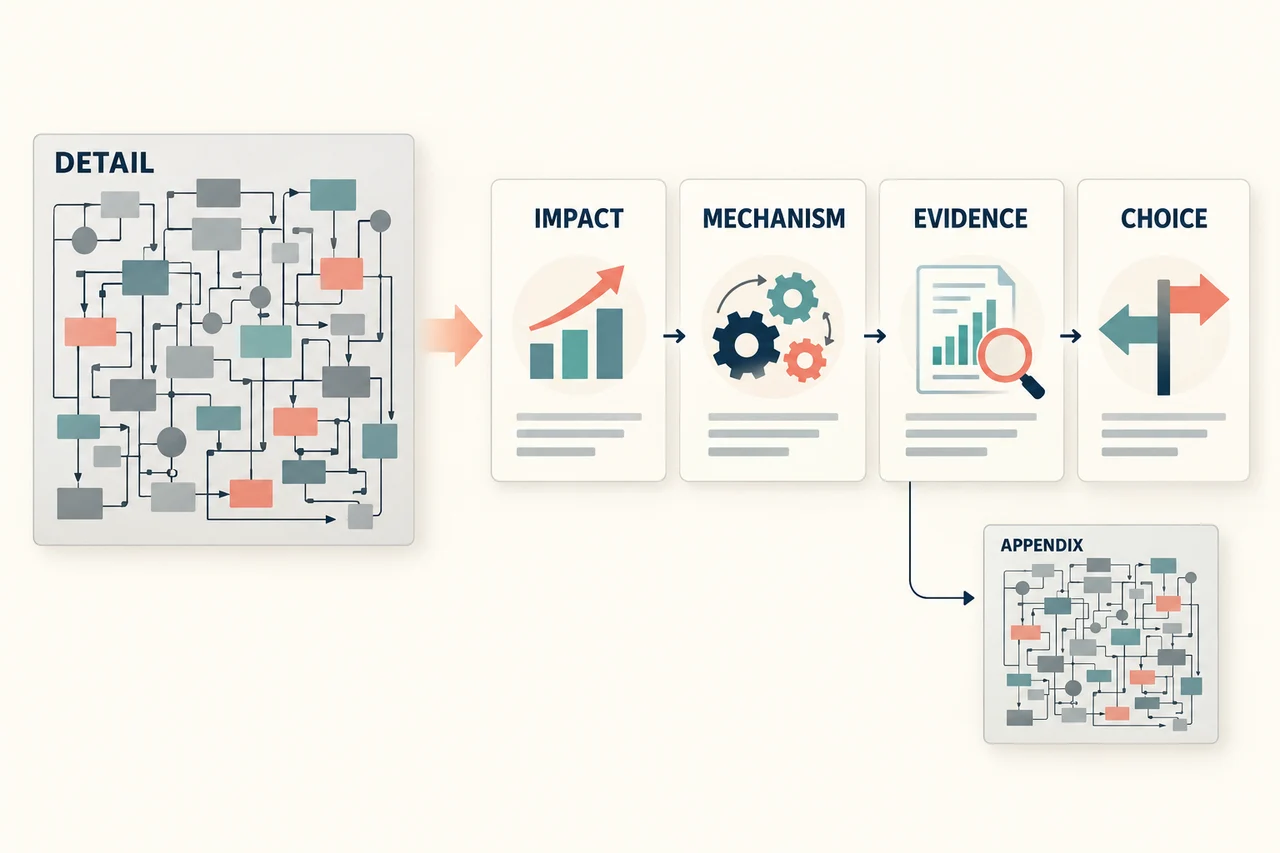
A traction slide shows what people have actually done with your business: paid, returned, used the product, completed a pilot or made another meaningful commitment. Choose a few measures that support one clear claim, show the period behind them, and make the difference between customers and prospects easy to see.
The best starting point is a question: what has changed since the business was only an idea? Answer it with your own records before you turn that evidence into a pitch deck. Presenti can help organize the material into a draft; the customer counts, definitions and commercial status must come from you.
Choose the claim before the metric
A slide headed “Traction” can become a collection of impressive-looking numbers. A more useful headline tells the audience what those numbers establish: “Paying accounts grew while early customers continued using the service.” The evidence beneath it then has a job to do.
Different stages call for different claims. An early prototype might demonstrate that participants completed a task. A pilot might establish repeat use in a small group. A business with paying customers can show the development of its customer base and recurring charges. None of these automatically proves the next stage.
| Evidence you have | What the slide can explain | What remains unanswered |
|---|---|---|
| Observed prototype sessions | Which task participants could complete and where they struggled | Whether they will adopt or pay for the product |
| Unpaid pilot use | Use within the pilot's conditions and duration | Whether use continues after the pilot or becomes a paid relationship |
| Paying accounts | Current commercial adoption under stated terms | Whether customers stay and whether delivery is economically sustainable |
| Repeat use or renewals | Continuation among a defined group | Whether the pattern extends to other customer groups |
Choose the strongest claim your evidence can support today. A small, well-defined result is more informative than combining several weaker measures into a large headline number.
Work one customer story through the numbers
Consider a fictional scheduling service for independent repair businesses. Each account pays $120 per month, with no discounts, usage charges or annual contracts in this example. One account means one paying business, even if several employees use it. The figures below are invented to demonstrate a traction slide.
| Month end | Active paying accounts | Monthly recurring charges at that date |
|---|---|---|
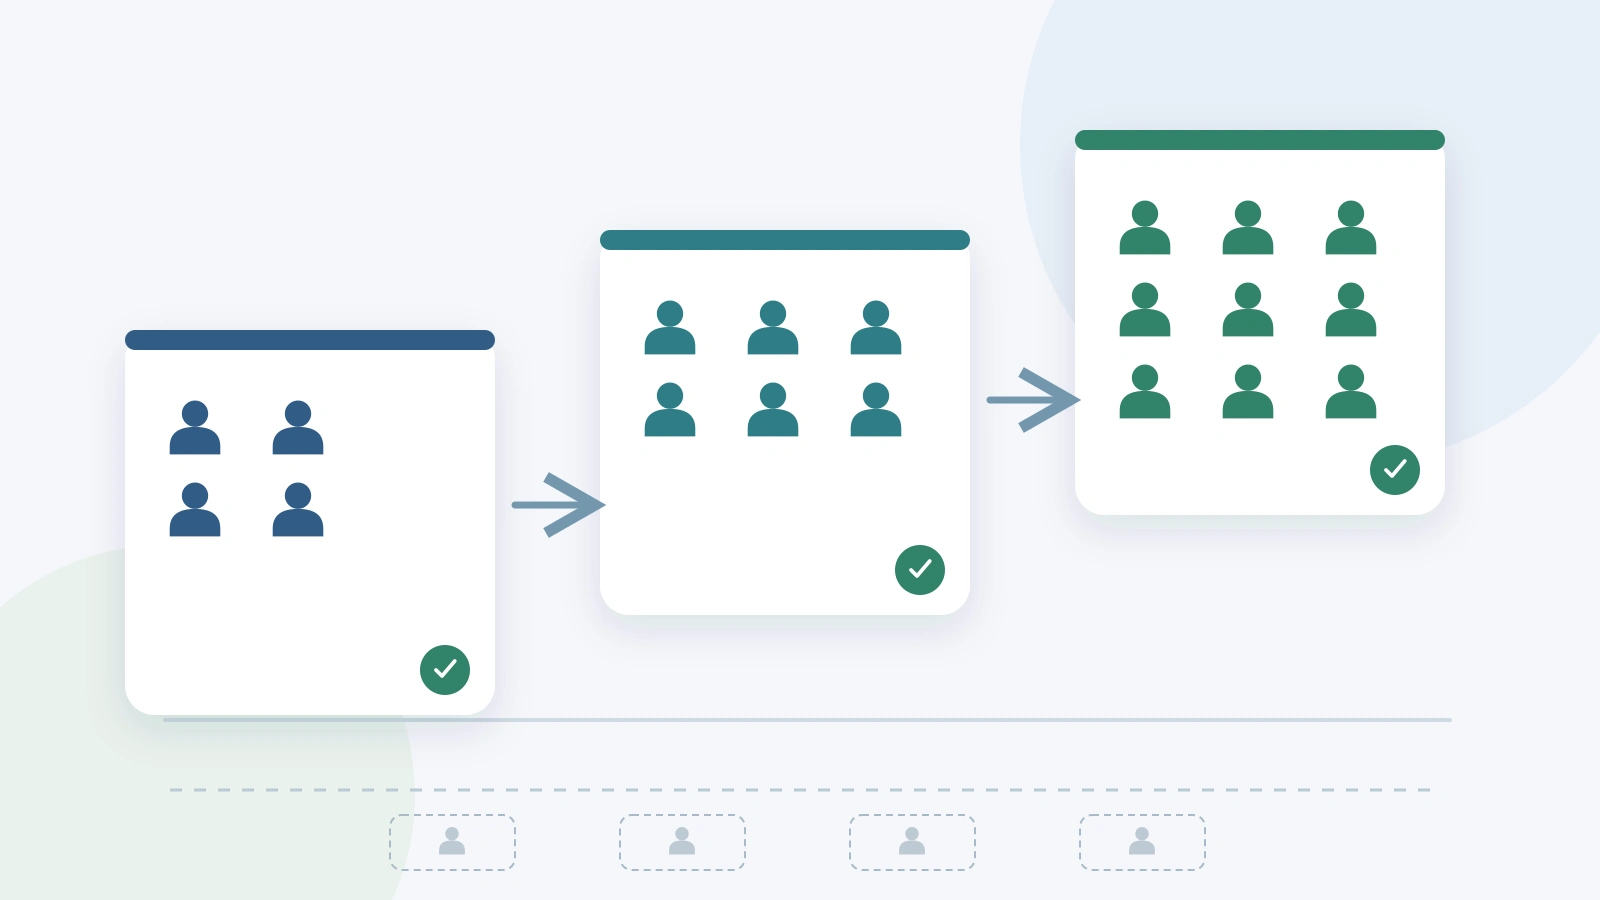
| January 31 | 8 | $960 |
| February 28 | 12 | $1,440 |
| March 31 | 18 | $2,160 |
February added five paying accounts and lost one: 8 + 5 − 1 = 12. March added eight and lost two: 12 + 8 − 2 = 18. Showing this movement makes it possible to understand growth without hiding departures.
The March recurring figure is 18 × $120 = $2,160. It describes the monthly subscription charges associated with the active accounts at month end. It is not the amount collected during March, recognized revenue for the quarter, or a forecast of what the business will earn next month.
Two further observations make the story more useful. Six of the eight businesses active on January 31 are still paying on March 31. During the last seven days of March, 14 of the 18 active paying businesses completed at least three work orders in the service. The first measure concerns continuation; the second concerns recent use. Keep their populations and time windows visible.

Build a slide with three reading levels
Use a headline, a main exhibit and two supporting facts. For this example, the headline could be “18 paying businesses; 6 of the original 8 remain.” It acknowledges both growth and what happened to the starting group.
Make the three month-end account counts the main exhibit. A simple column chart with a zero baseline is sufficient. Label the columns January 31, February 28 and March 31, and place 8, 12 and 18 directly above them. Do not add a decorative trendline that suggests a longer history than three observations.
Beside the chart, place two concise statements:
- $2,160 monthly recurring charges at March 31, from 18 accounts at $120 each.
- 14 of 18 paying businesses used the core workflow at least three times in the final seven days of March.
Put the account definition and date beneath the exhibit in readable text. The longer explanation of customer additions and losses can stay in your speaker notes or a backup slide. It should still be available when someone asks how the total changed.
A short spoken explanation might be: “We ended March with 18 paying businesses, compared with eight at the end of January. Six of those original eight are still paying. Fourteen of the current 18 completed at least three work orders in the last week of March. We are examining why two early customers left before expanding the next cohort.”
Keep interest out of the customer total
Suppose the same business also has nine unpaid trials and three nonbinding letters of intent. Adding those to 18 paying accounts would produce “30 customers,” but it would conceal three very different relationships.
If the trials and letters matter to the discussion, show them in a separate, clearly labeled pipeline area: “9 unpaid trials; 3 nonbinding letters of intent.” Explain any overlap rather than assuming the groups are independent. A prospect might be both in a trial and a signatory to a letter.
The distinction also matters for logos. A recognizable company may have attended a demonstration without buying anything. Only use a logo when you have permission and can accurately describe the relationship. A text description of the actual engagement is preferable to a logo wall that leaves the audience guessing.
For a business without revenue, a traction slide can still be useful. Show the evidence you do have: the number invited into a pilot, how many started, which task they completed, and whether they returned during the stated period. Include the conditions, such as hands-on assistance from your team. That makes the result interpretable without pretending it is paid demand.
Make growth and retention comparable
In the example, paying accounts rose from eight to 18, an increase of 125%. The percentage is correct, but the absolute counts tell the audience how small the base is. If you include the percentage, show the two counts and dates alongside it.
Use the same definition at each date. Counting signed contracts in January and active subscriptions in March creates a comparison that may look like growth even when the measurement changed. Likewise, changing from business accounts to individual users can inflate a trend without adding customers.
Retention needs a fixed starting group. Six of January's eight businesses remain at the end of March, or 75% of that group. Dividing six by all 18 March accounts would answer a different question. Avoid projecting this short, small-cohort observation into an annual retention claim.
In a real business, discounts, plan changes, pauses and cancellations may make recurring revenue more complicated than account count times one price. State the definition you actually use and keep the underlying calculation available. The slide should simplify the explanation, not quietly change the metric.
Prepare the material behind the slide
Collect a small source table with the observation date, metric definition, value and supporting record. For the example, the sources would be subscription records for paid status, account history for the January cohort and activity records for completed work orders. Customer identities do not need to be exposed on the public slide.
Supply those verified facts to your presentation draft as separate statements. Specify which are observed results and which are future aims. Ask for a single main exhibit and readable labels, then compare every generated number and claim with the source table. Remove any forecast, customer endorsement or interpretation that was not supplied.
Use the investor update format when the task becomes regular reporting to existing backers. A pitch traction slide introduces the evidence of progress; an ongoing update should also explain changes in plans, difficulties and specific requests. Keeping those jobs separate helps each presentation stay focused.