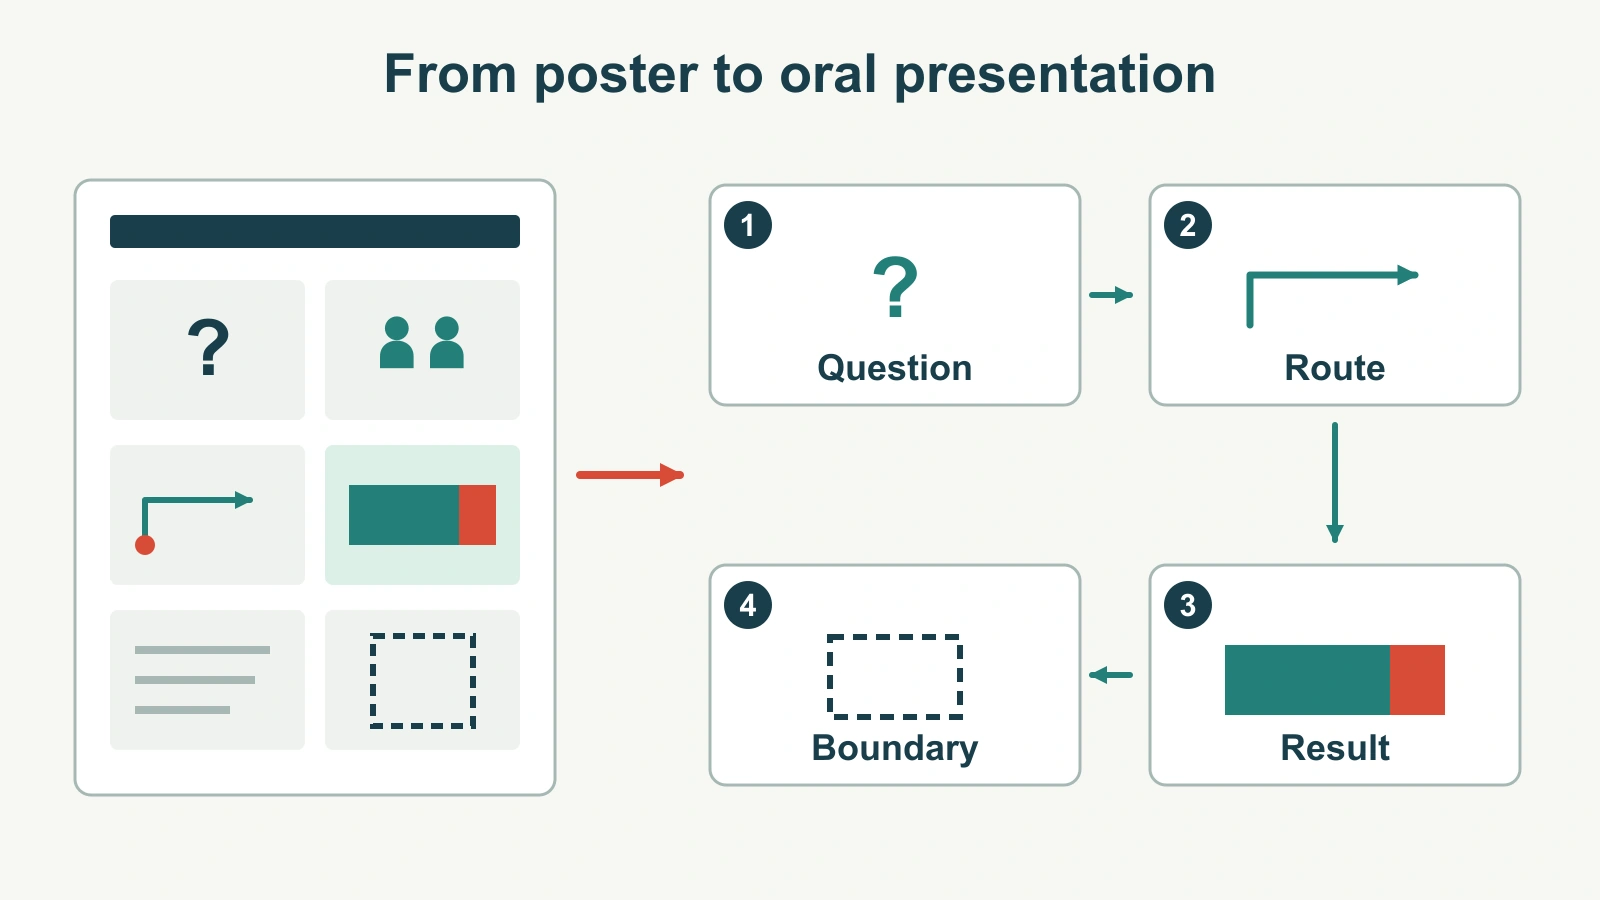
To turn a research poster into an oral presentation, rebuild it as a sequence of questions and answers. Do not place the whole poster on one slide and zoom through its columns. Select the result the audience needs to understand, introduce just enough method to interpret it, and carry the result's qualifications into the new format.
A poster lets readers choose where to look and how long to stay. A talk sets the pace for everyone. Your job is therefore not to copy every panel, but to decide what the audience needs at each moment. Presenti's research and education presentation workflow can help organize a draft from prepared material; the poster's figures, findings and references still need to remain faithful to the research.
Choose the question the talk will answer
Begin with the audience and the available time. A brief lab update, a class presentation and a conference talk do not need the same amount of background. Follow the actual event instructions for duration, slide format and questions; there is no universal poster-to-talk slide count.
For a worked example, imagine a fictional poster about finding a study room in a university library. Twenty-four adult volunteers each attempt the same route once using the current signs. Eighteen reach the room without asking for help; six ask for assistance. The example is a small descriptive exercise, not a real study or evidence that a particular sign design works.
The talk's question is “Could these volunteers find this room unaided?” It is not “How do we solve wayfinding across every library?” That smaller question gives the audience a clear basis for interpreting the result.
Write one sentence you want listeners to remember: “Eighteen of 24 volunteers reached the room unaided; the six assisted attempts are the next cases to examine.” This sentence makes room for both the finding and the unresolved question.
Map poster panels to speaking beats
The example poster has six panels: question, method, route diagram, results, field notes, and limitations with references. Reading those panels in their printed order is one possible route, but it may not be the clearest oral explanation. The audience may need to see the route before the method makes sense.
| Poster material | Job in the talk | What to keep visible |
|---|---|---|
| Question and background | Explain the practical problem. | The room-finding question and why this route was examined. |
| Route diagram | Give the audience a shared spatial reference. | Entrance, destination and relevant junctions. |
| Method | Define what was observed. | 24 volunteers; one attempt each; unaided completion as the outcome. |
| Results | Answer the question. | 18 unaided and six assisted attempts, with the total of 24. |
| Field notes | Identify questions for closer examination. | Only observations that were actually recorded; no invented reason for every assisted attempt. |
| Limitations and references | Set the boundary and support follow-up. | One route and volunteer group; relevant sources and supporting detail. |
That map is a working storyboard, not a rule that requires exactly six slides. The route and method might share a slide in a short talk. A complex result might need two. The useful unit is a speaking beat: one question the audience can follow before you move on.
If your starting point is a full paper rather than a poster, the research-paper-to-presentation guide deals with a different selection problem. A poster has already compressed the research; you may need to restore context from the original study files rather than shorten it again.
Rebuild the result from the original figure
Open the original chart or source data if you have it. Copying a small chart out of a poster image can make labels unreadable, and enlarging the crop will not restore detail that was never in the file. The talk needs a figure sized for the slide, not a magnified fragment of the poster.
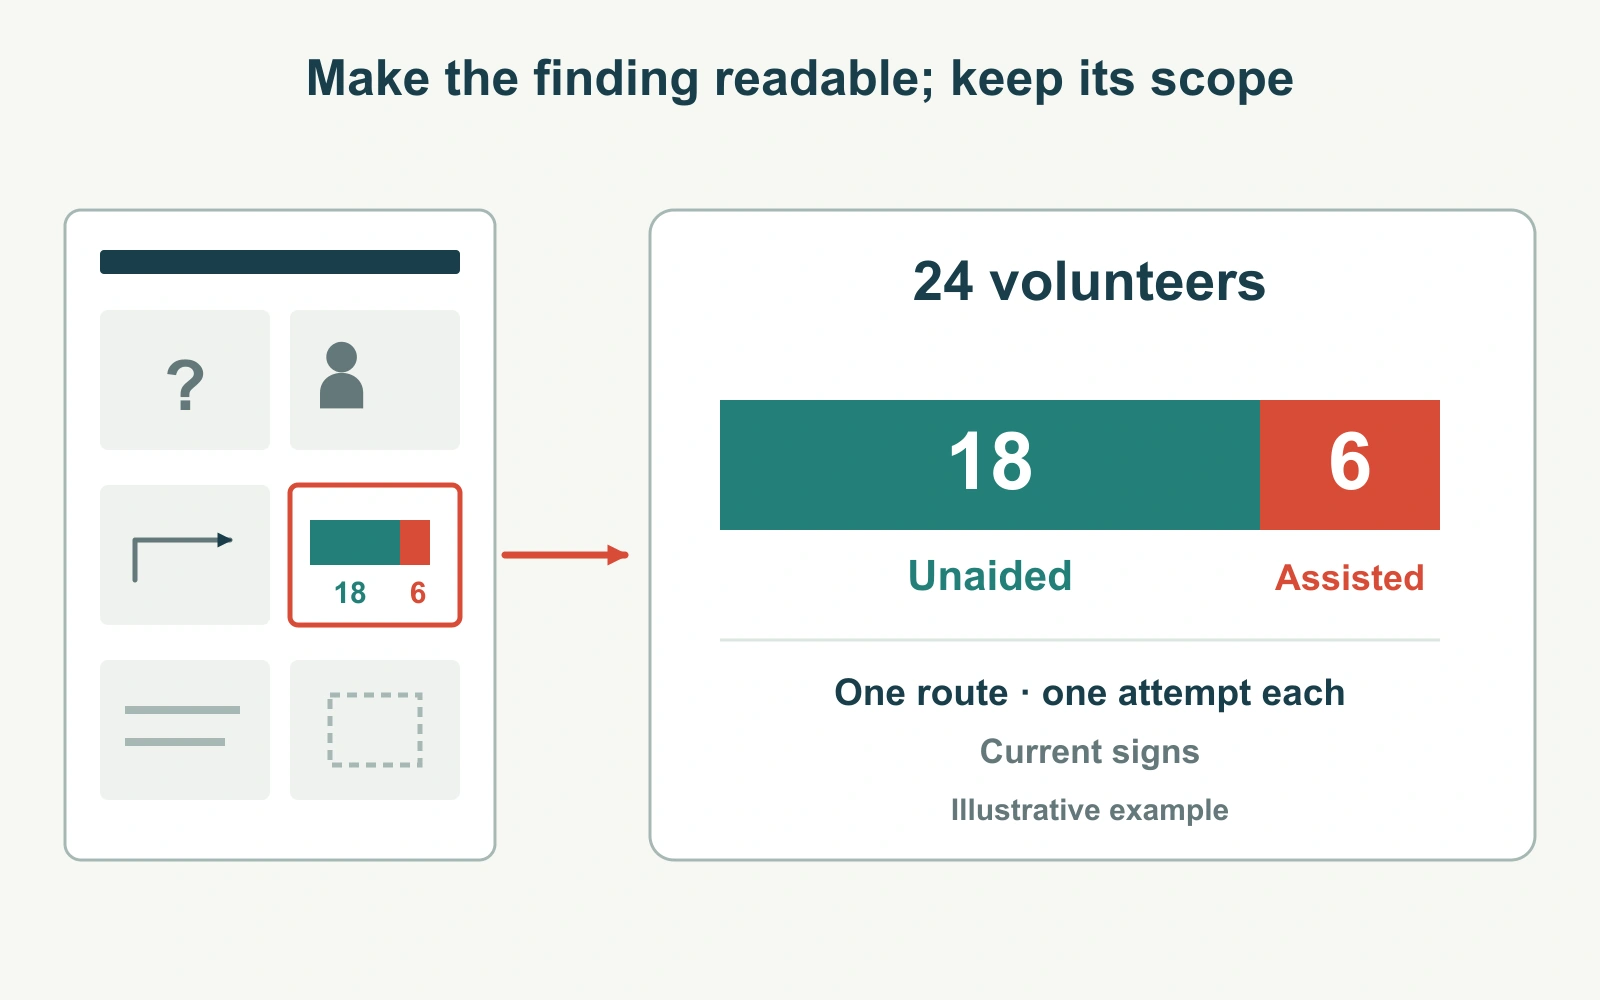
For the example, a simple two-category chart or a row of 24 marks can show the result: 18 completed unaided, six needed assistance. If you display percentages, the calculations are 18 ÷ 24 = 75% and 6 ÷ 24 = 25%. Keep the counts too. A large “75% success” badge loses the population and the definition of success.
Use a title that states the observation: “18 of 24 volunteers reached the study room unaided.” Keep a short method line with it: “One route; one attempt per volunteer; current signs.” The audience should not need to remember a qualification from a slide several minutes earlier.
If the original research includes uncertainty intervals, comparison groups, missing responses or exclusions, preserve the information needed to interpret the result. Do not remove an error bar because the slide looks cleaner without it. Do not change the scale merely to make a difference appear dramatic.
The example does not compare two sign systems or establish a cause for the six assisted attempts. Its slide should therefore not say “the signs failed 25% of visitors” or “new signs will improve success by 25%.” Neither claim follows from the stated observation.
Give method detail a clear place
A poster often uses dense text for recruitment, procedure and analysis because readers can stop and inspect it. In a talk, decide which parts are necessary before the audience sees the result and which can sit in supporting slides.
The audience needs to know what counted as unaided completion, who attempted the route and whether the procedure was comparable across participants. Detailed instructions, a fuller route map and the observation sheet can be available for questions. Move supporting detail; do not erase it from the working material.
References work the same way. Put the relevant citation beside a borrowed claim, method or figure, and keep the full reference in an accessible reference section or companion document. An opening slide that says “sources at the end” does not tell listeners which source supports the chart they are looking at. The research presentation citation guide explains how to keep that connection visible.
Retain author, collaborator and funding acknowledgments where they are required. A shorter delivery format is not a reason to remove credit or reuse a figure beyond its permitted terms.
Plan what you will say, not just what you will show
The slide does not need to contain your complete explanation. For the route diagram, you might say: “Everyone started here and tried to reach this study room. We recorded whether they asked for assistance.” The image establishes the space; your words explain the observation.
At the results slide, pause long enough for listeners to see the two groups. State the result, then its boundary: “Eighteen completed the route unaided. This describes these 24 volunteers on this route; it does not tell us how visitors would perform elsewhere in the building.” The qualification belongs with the result, not as a hurried disclaimer after the conclusion.
Time the actual explanation with the figures on screen. If the talk runs long, remove a secondary question or move its detail to support. Racing through every poster panel usually leaves the audience with less understanding, even though more material was technically shown.
Keep a clear next step for the example: review the recorded paths and assistance points before choosing a sign change to test. That follows from the available information without turning a descriptive observation into a completed solution.
Prepare the draft from a panel map
Give the drafting tool the speaking sequence and the information each result must retain. A useful brief is more specific than “convert this poster to slides”:
Prepare an oral presentation from this poster. Start with the room-finding question, show the route, define the observation, then present the result and its boundary. Use the supplied fictional figures exactly: 24 volunteers, one route attempt each, 18 unaided completions and six assisted attempts. Keep the denominator and method line on the result slide. Do not infer a cause, invent a comparison group or describe a proposed sign change as tested. Keep detailed methods and full references available as supporting material.
Compare the resulting outline with the panel map before refining the design. If a necessary qualification has disappeared, restore it in the relevant result slide rather than adding a generic warning to the end. If the draft adds a finding that the poster never reported, remove it.
Keep the poster available as a companion for readers who want the spatial overview and detail. The oral presentation has a different strength: it can lead the audience through one question, the evidence that answers it and the next question worth asking.