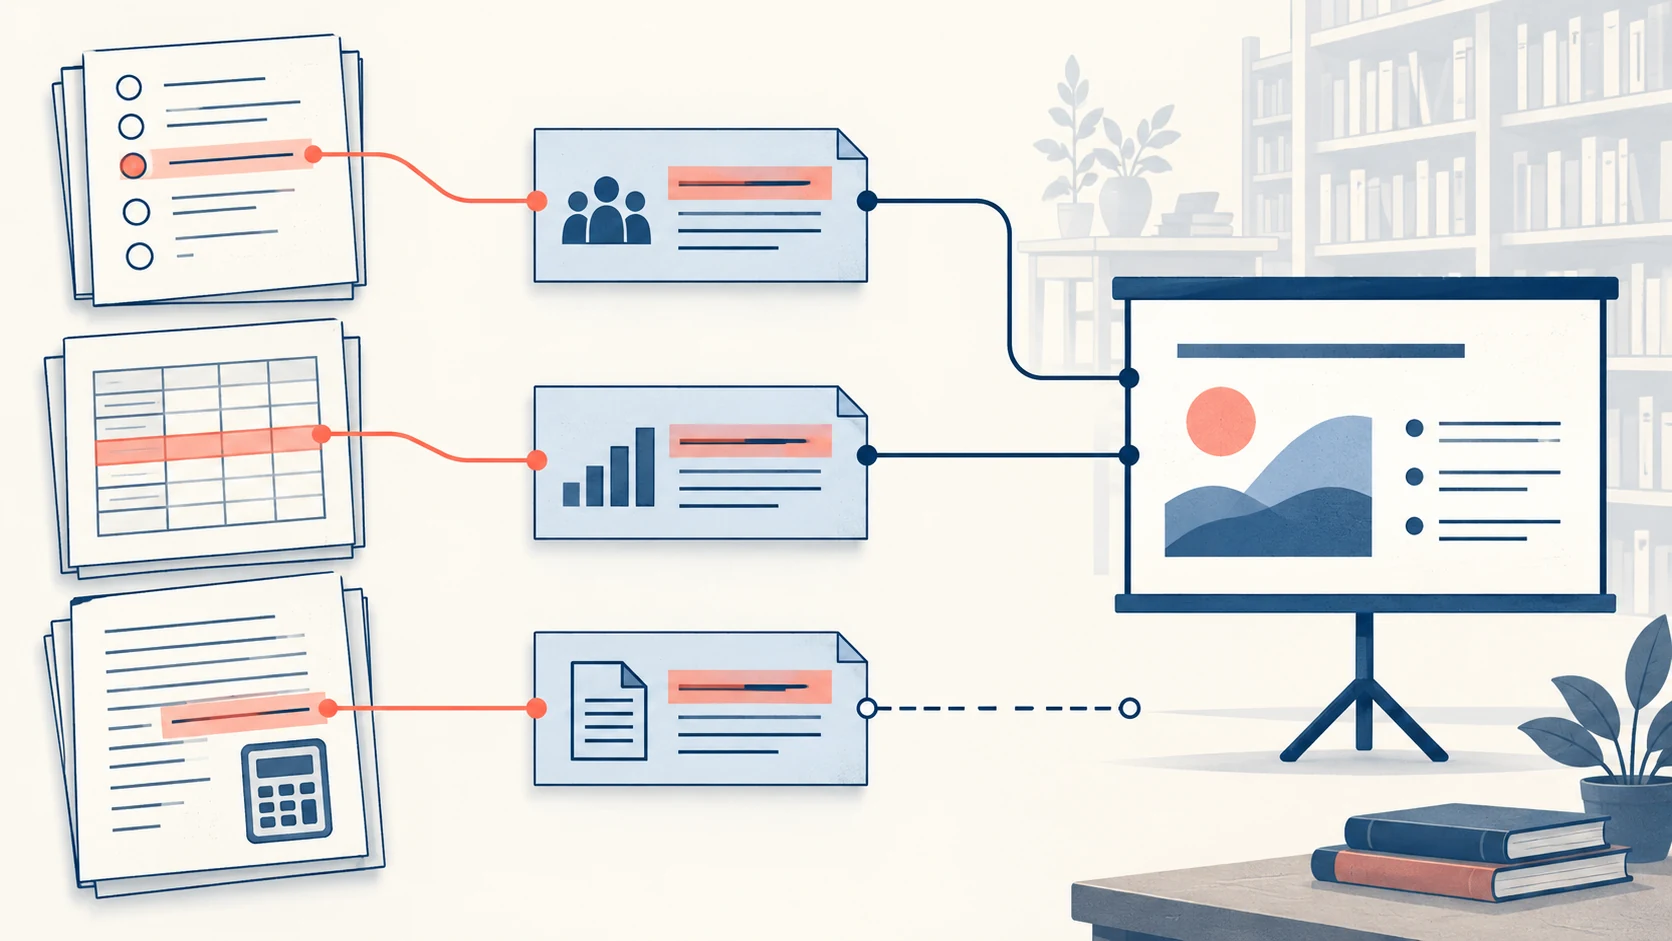
A research presentation needs more than a references slide. Each important claim should lead to the exact evidence behind it: the source, the relevant passage or table, and the limits of what that evidence establishes. Build those connections before turning a collection of documents into slides.
The practical order is question → claim → evidence → source → implication. If you also need to decide which findings belong in the main narrative, use the broader data storytelling workflow for presentations. This guide tackles the narrower problem of keeping a multi-source argument traceable as you shorten it for an audience.
Start with a question the evidence can answer
Suppose a university library is considering later evening opening hours. The presentation must answer: should the library run a limited late-opening trial? It does not need to prove that all students prefer longer hours or that late opening improves academic results.
For this fictional example, you have three sources: a voluntary student survey, evening entrance counts, and a staffing estimate. Treat these as different kinds of evidence. The survey describes what respondents said. Entrance counts describe use during the hours already offered. A staffing estimate describes a possible cost, not a measured result. Combining them does not erase those differences.
Write the decision on a separate line from the research question. The question is whether there is enough unmet demand to investigate. The decision is whether to authorize a trial. That distinction allows a useful recommendation even when the evidence cannot justify permanent opening hours.
Make a claim-to-source map, not a bibliography dump
Before designing slides, give each source a short identifier and record its title, author or owner, date, version, location, and the exact table, page, or passage you used. Store the full citation separately from the sentence you intend to put on a slide. A document can be relevant without supporting your particular claim.
| Candidate claim | Evidence in this fictional example | What the slide can say |
|---|---|---|
| Students want later hours | S1: 60 of 100 voluntary survey respondents requested them | 60% of survey respondents requested later hours |
| Evening use is substantial | S2: entrance counts for the final two open hours, over four specified weeks | Report the observed counts and dates, not demand after closing |
| A trial is affordable | S3: staffing estimate with an assumed rota | Show the estimated cost and the staffing assumptions |
The middle column is where weak arguments become visible. If there is no evidence for “affordable,” the presentation needs a budget threshold or a decision from the budget owner. Do not turn an available estimate into a value judgment simply because the slide needs a headline.
Work one finding all the way into a slide
Start with the survey result: 60 of 100 respondents selected later opening. A defensible title is “60% of respondents asked for later library hours.” A stronger-sounding title such as “Most students need late-night access” changes both the population and the claim.
- Visual: show 60 requesting later hours and 40 not selecting that response; identify the measure as responses, not students across the university.
- Visible source: “Library opening-hours survey, S1, question 4; n = 100; voluntary response.” Replace the label with the real document details in your own deck.
- Speaker explanation: “This is evidence of interest among respondents. We do not know whether the sample represents the whole student population.”
- Implication: “Use a trial to measure actual attendance before committing to permanent hours.”
The percentage is 60 ÷ 100 × 100. Keep the denominator with the result. If a later survey has 36 requests among 90 respondents, its result is 40%; comparing 60 requests with 36 requests alone hides the different sample sizes. Even the percentage comparison does not establish a trend unless recruitment, wording, and timing are sufficiently comparable.
When sources disagree, keep the disagreement useful
Imagine the second survey is from an exam period and the first is from the start of term. Before averaging them, ask whether they measured the same population under similar conditions. A pooled percentage would be mathematically possible but might answer no useful question.
Build a comparison around the differences: when each survey ran, who could respond, the exact question, and the response count. If the sources address different situations, present them as separate findings. If they genuinely conflict, show both and explain which uncertainty matters to the decision.
For the library trial, the remaining question might be whether stated interest turns into attendance after the normal closing time. Existing entrance counts cannot answer that because the building was closed. That gap suggests a measurement plan, not an invitation to invent a forecast.
Use two citation layers so the slide stays readable
Place a short source label beside the claim or chart, then provide a full retrievable reference in an appendix or accompanying document. Reuse the same source identifier throughout the deck. If two charts on one slide come from different sources, label them separately rather than placing one ambiguous citation at the bottom.
APA’s citation guidance explains how a brief author–date citation connects to a full reference and requires attribution for paraphrases as well as quotations. Follow your institution’s required style; the source identifiers in this example are working labels, not a substitute for that style.
Put decision-changing qualifications on the slide itself. A limitation hidden in speaker notes disappears when someone receives only the slides. Longer methods detail can live in the appendix, but the audience should not have to search there to discover that a figure is an estimate.
Arrange the evidence into a seven-slide argument
- Question: should the library test later opening hours?
- Interest: survey responses, with the sample definition and source.
- Current use: entrance counts for the observed evening period.
- Uncertainty: why current data does not reveal attendance after closing.
- Feasibility: staffing options and clearly labeled cost estimates.
- Proposed trial: opening schedule, attendance measure, cost ceiling, and decision date.
- Decision requested: approve the trial, revise it, or request missing evidence.
Keep the full reference list and detailed source extracts after the main argument. The seven slides are a worked structure, not a universal length requirement. Combine or expand them according to the audience’s questions and the available speaking time.
Move to an AI draft without losing the evidence trail
Prepare an outline that contains each approved title, the exact supporting values, its source identifier, and any qualification that must remain visible. Presenti’s text-to-presentation page describes turning text into an editable slide draft. Use the approved outline as the input, not a request to invent missing research.
After generation, compare each slide with the claim-to-source map. Restore a missing denominator, soften an unsupported title, and check that every source label still points to the right finding. A polished layout cannot confirm that a citation supports a claim; that judgment stays with the researcher.
Before sharing, open the actual delivery file and follow one important claim back to its original source. Then try a claim with a caveat or conflicting evidence. If both paths remain understandable without your narration, the deck is ready for an informed discussion rather than simply a convincing performance.