Converting a research paper to PPT looks simple in theory. You have the content — months or years of work, a clear argument, and real findings. Slides should be easy. In practice, most researchers end up with one of two problems: a presentation that is so dense it reads like a printed page, or one so thinned-out that the logic has evaporated. The gap between a well-written paper and a well-designed research paper to presentation is wider than it looks. This guide gives you a named, slide-by-slide template, a clear account of what needs to change in the translation, specific advice for conference talks, and a step-by-step AI workflow using Presenti AI to get there faster.
Why a Research Paper Doesn’t Translate Directly to Slides
A paper lets readers pause and revisit evidence. A live presentation must guide listeners through the argument at a shared pace. The same findings therefore need a different structure and level of detail.
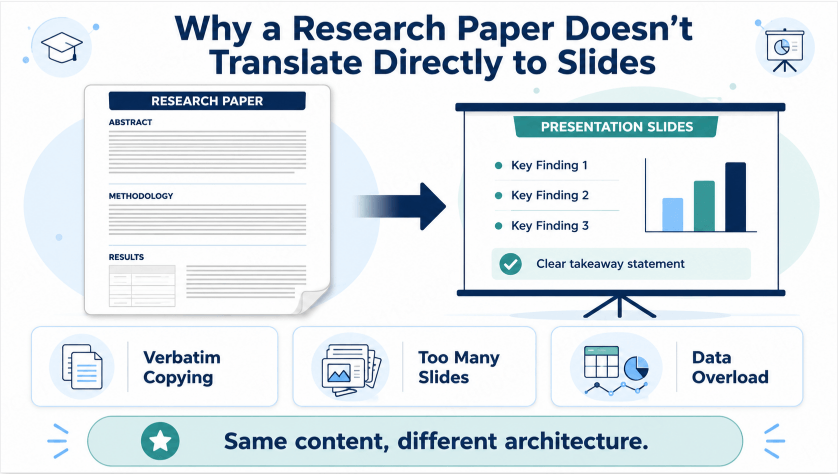
A paper can develop an argument through detailed sections, notes and supporting analyses. A live talk has to fit the venue’s speaking time and the audience’s background. There is no single paper length, slide count or words-per-slide target that suits every discipline. Keep the evidence and qualifications needed to understand the contribution, then rehearse to decide how much can be explained.
Three mistakes recur in almost every poorly executed research paper to presentation conversion:
- Verbatim copying. Pasting paragraph-length text onto slides is the single most common error. Dense prose that works on the page becomes unreadable when projected. Audiences either read the slide and ignore the speaker, or follow the speaker and ignore the slide. Neither is useful.
- Too many slides for the available time. Set the main deck around the argument and the session’s time limit. A dense results chart may need several minutes, while a transition may take seconds. Rehearse aloud, preserve question time when required, and move secondary material to an appendix.
- Data overload. Results sections in papers routinely contain tables, supplementary figures, and secondary analyses. Trying to put all of it on slides produces slides that no one can read. The results section in a presentation should contain the two or three findings that drive the paper’s central claim — nothing more.
The core shift required when converting a research paper to PPT is moving from a written academic argument to a spoken visual narrative. The evidence does not change. The structure changes substantially.
An 11-Part Research Presentation Framework
Every research paper to slide template has to accomplish the same narrative arc: establish a problem, show how you approached it, present what you found, and explain what it means. The following 11-part framework covers that arc reliably across disciplines, from the natural sciences to the humanities.
Use the framework as a starting point, with some sections combined or expanded. Confirm whether the time slot includes questions, then rehearse to choose the slide count.
A note on the opening. Give the audience enough context to understand the problem and contribution. At an interdisciplinary conference, that may require more background than a specialist seminar.
A note on Related Work. In the paper, related work may occupy multiple pages. In the presentation, it gets one slide. Selecting which prior work to mention — and which to cut — is not a loss of rigor; it is an act of editorial judgment that respects your audience’s time and attention.
A note on Limitations. Skip it and you will be asked about it in Q&A, where it will be harder to address gracefully. One concise slide on limitations signals intellectual honesty and disarms the most common form of committee-style questioning.
The article “Two Minutes More!” Preparing Slides for Conference Research Presentations recommends concise slide text and checking chart and table values against the manuscript. Choose a visual when it makes the finding easier to understand; do not turn those suggestions into a universal bullet-count rule. Follow the conference’s actual format and timing requirements.
4 Stages to Build a Conference Presentation from a Research Paper
A conference presentation from a research paper is not a shorter version of the paper. It is a purpose-built communication artifact that borrows from the paper’s content.
1. The audience is field-literate but not paper-familiar
They know the area. They do not know your specific study, your methods choices, or the nuances of your dataset. You do not need to explain foundational concepts. You do need to explain what you did differently and why it matters.
2. Lead with contribution, not background
The most effective conference talks open with a clear statement of contribution — “We show that X” or “This paper challenges the assumption that Y” — before establishing context. Background slides exist to make the contribution legible, not to demonstrate that you have read the literature.
3. Confirm your presentation slide count
Use the following formats as different planning situations, not as fixed slide-count rules. Confirm the organizer’s instructions, including whether the time slot includes questions.
- Short conference talk: choose the central contribution and reserve enough time to explain its key figure. Move secondary analyses to an appendix.
- Longer conference slot: use the extra time for necessary methods, uncertainty or competing interpretations rather than automatically adding background slides.
- Lightning talk: give the audience one question, a concise explanation of the approach and the finding they should remember. Rehearse against the exact slot rather than relying on a maximum slide count.
4. The Q&A slide problem
Most presenters end with a plain “Thank You” slide — a completely blank backdrop for the most intellectually active part of the session. Your final slide should display something useful during Q&A: a concise restatement of your key finding, your contact details, or a summary of your contributions. Design the Q&A slide the same way you design the rest of the deck.
Step-by-Step Guide: Convert Research Paper to PPT with Presenti AI
An AI presentation tool can help arrange source material into a first draft. The amount of editing depends on the paper and the audience. The workflow below uses Presenti for drafting; it does not replace checking figures, citations or the research argument.
Step 1: Upload the paper PDF or paste the abstract and key sections
If your Presenti plan includes PDF import, upload a paper you are permitted to use. Alternatively, prepare an approved text outline with the research question, method, results and limitations. Review the generated structure against the source: section headings do not guarantee that the draft has interpreted the argument correctly.
Step 2: Review the AI-generated outline
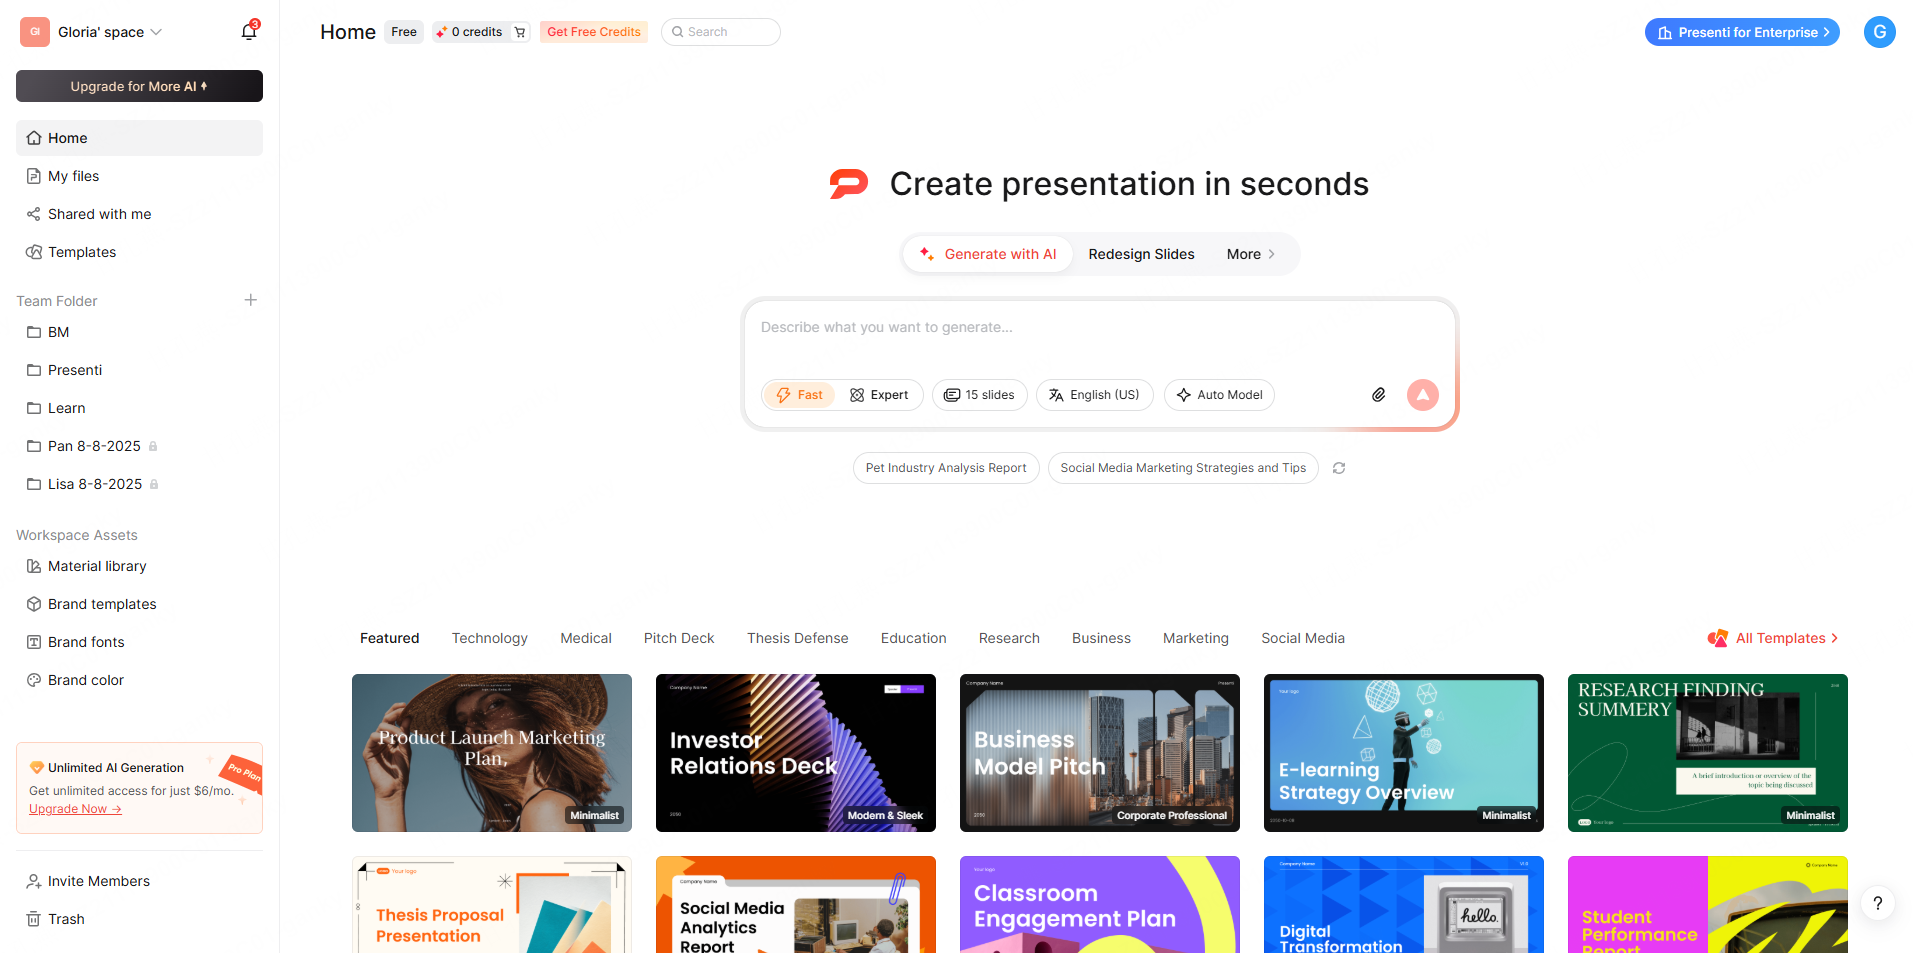
Before any slides are created, Presenti presents the full outline for review. Check that section coverage is correct, the order makes logical sense, and no major component has been over- or under-weighted. This is the moment to cut the related work section down to one slide, combine any redundant sections, and reorder if the default structure does not match your intended narrative.
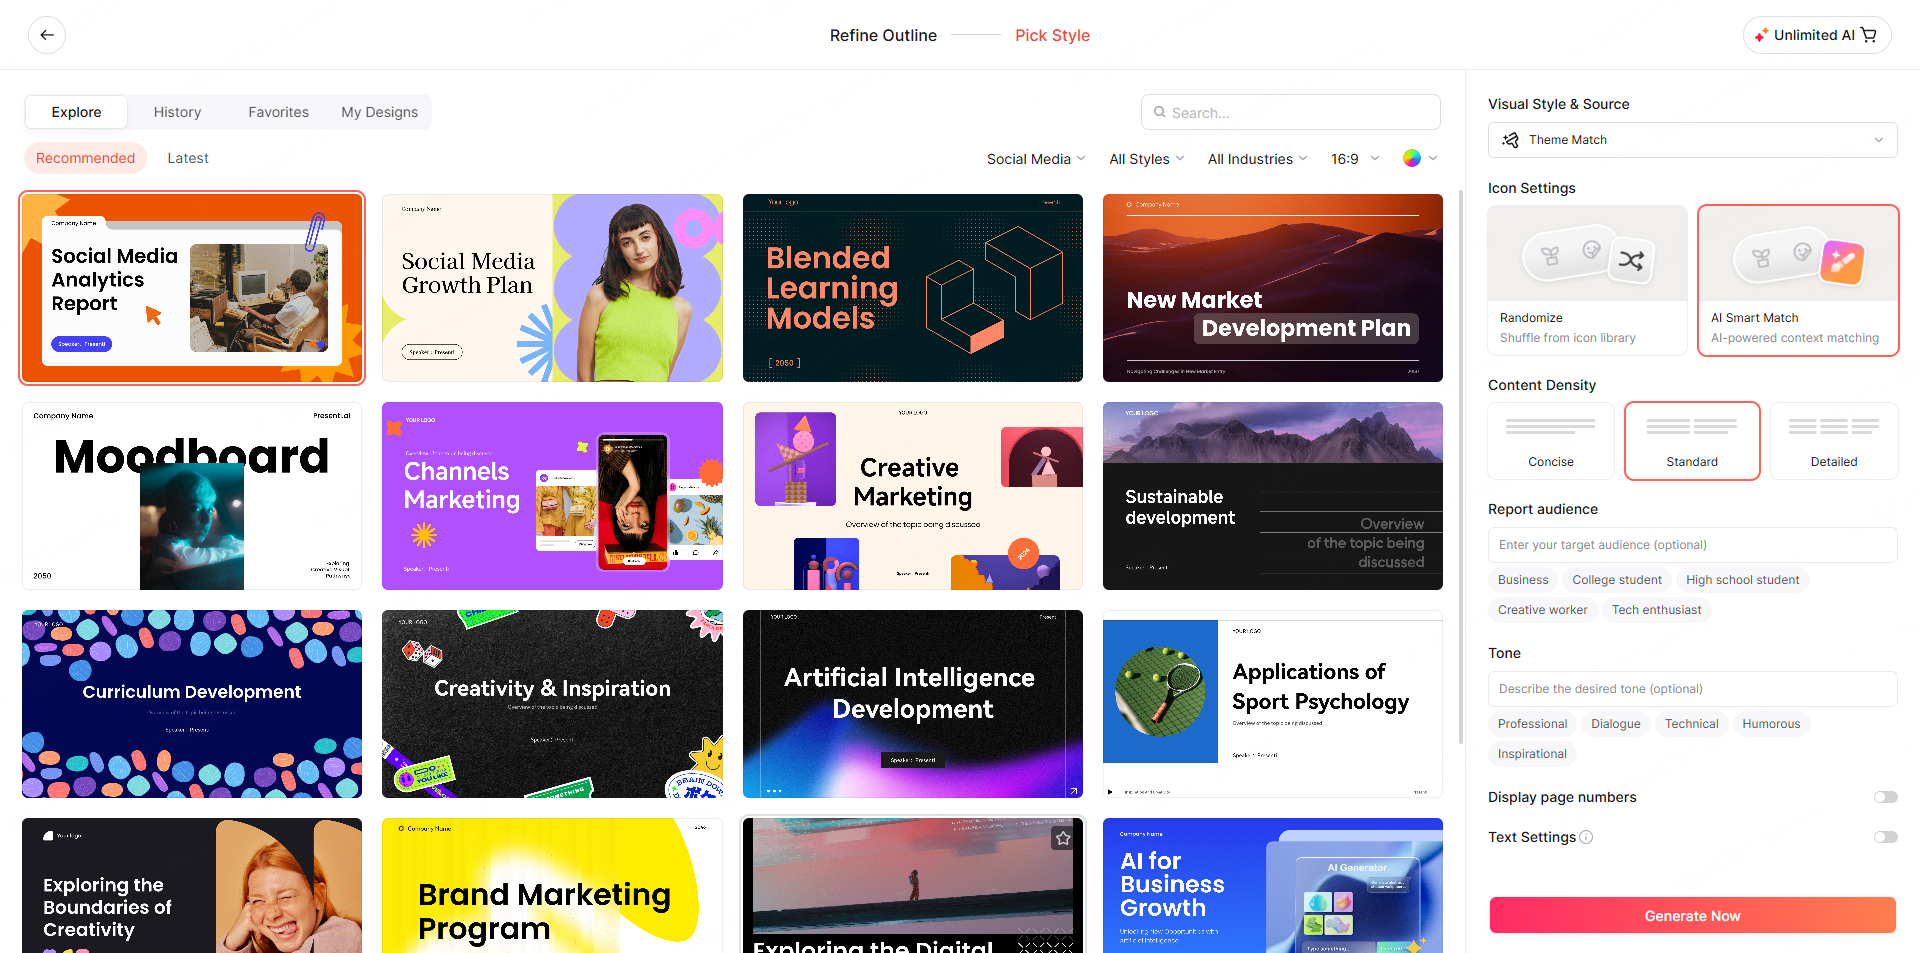
Step 3: Select an academic template
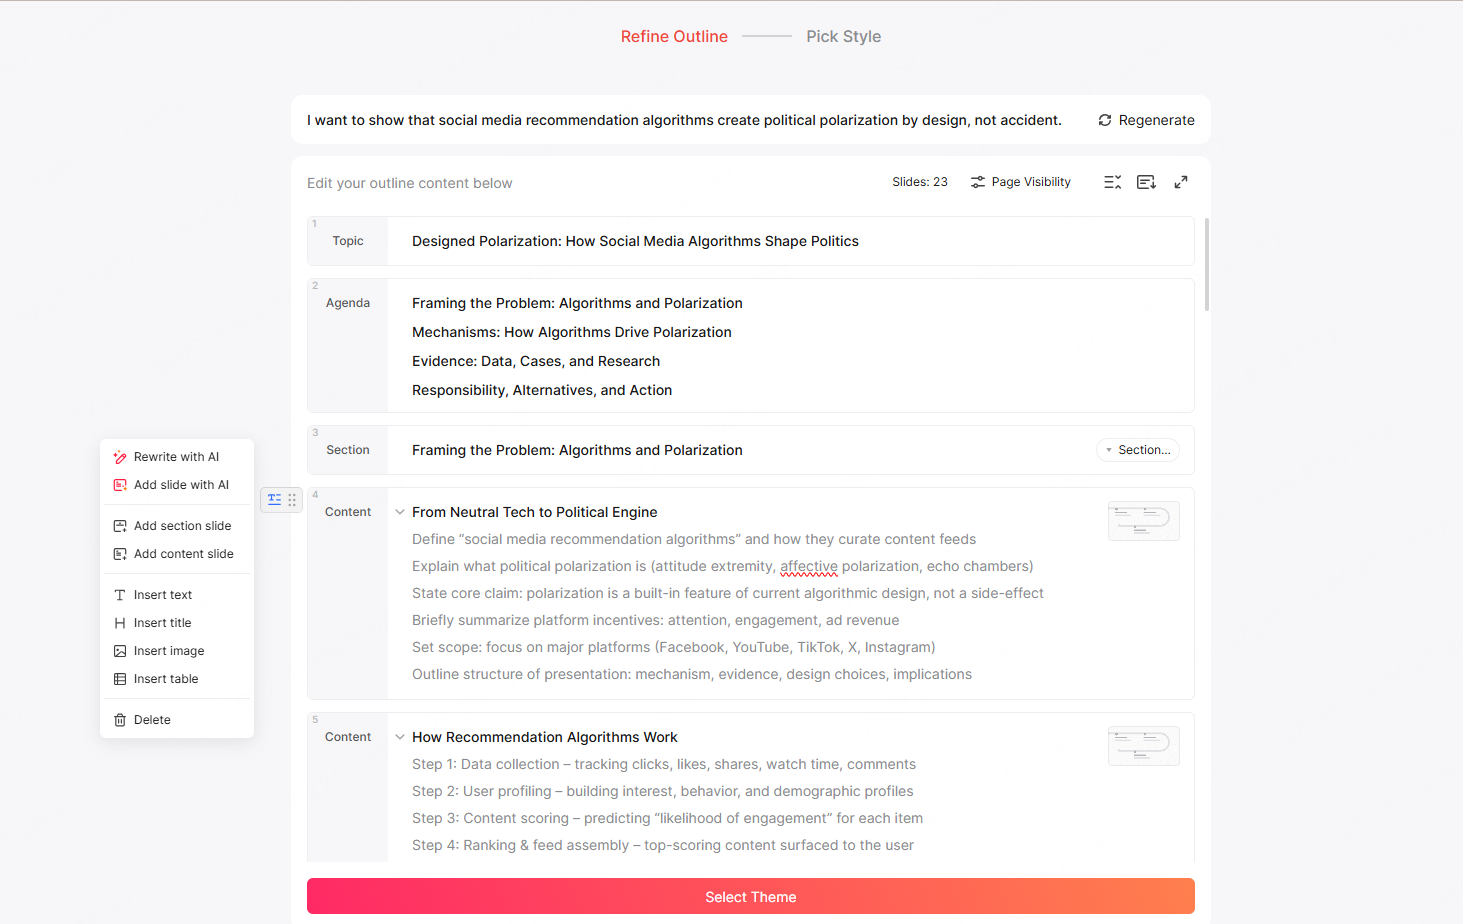
Presenti’s template library includes clean, data-friendly academic styles suited for conference settings — minimal decoration, high contrast, readable at distance, with layouts designed for charts and figures rather than decorative imagery. Select a template that matches the formality of your venue.
Step 4: Generate slides
Presenti applies the approved outline to the chosen template, laying out content, typography, and design elements automatically. Review the generated draft before preparing the final file.

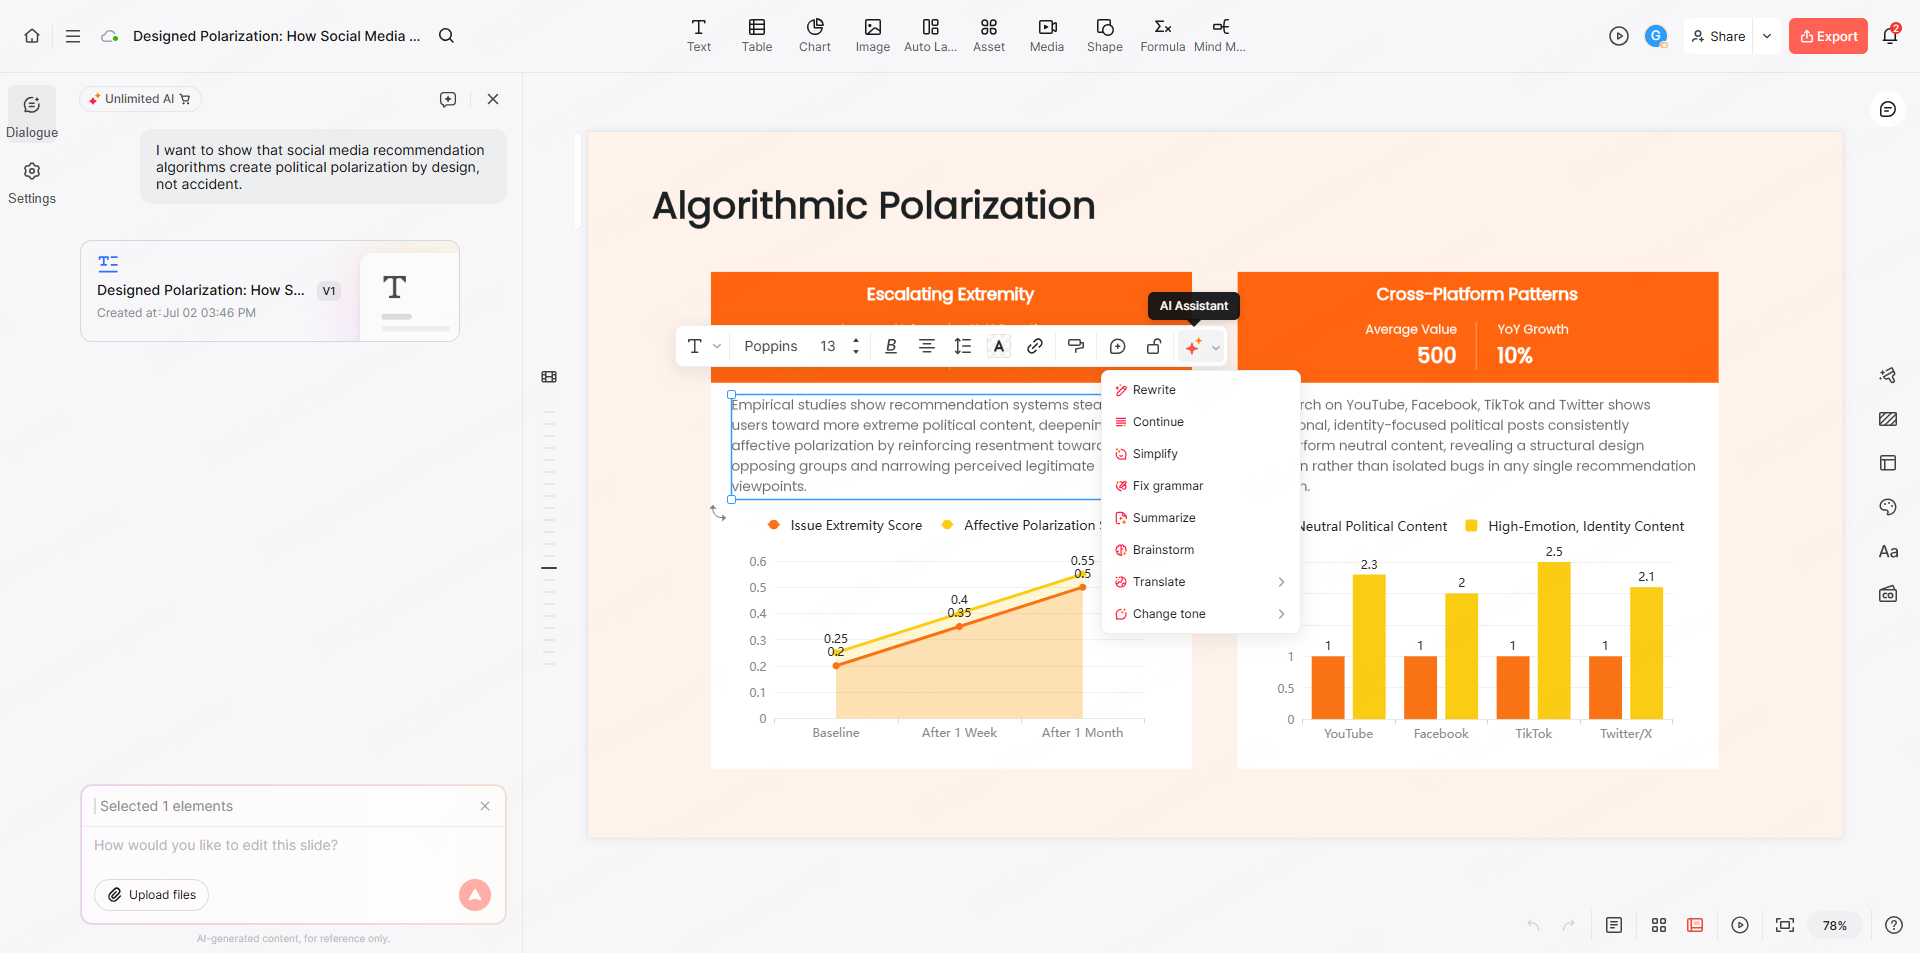
Step 5: Refine Your Presentation
Presenti lets you give direct instructions: “Reframe the opening around the contribution rather than the gap.” Review the changed section and surrounding slides to confirm the edit preserves the intended argument.
Step 6: Final human review
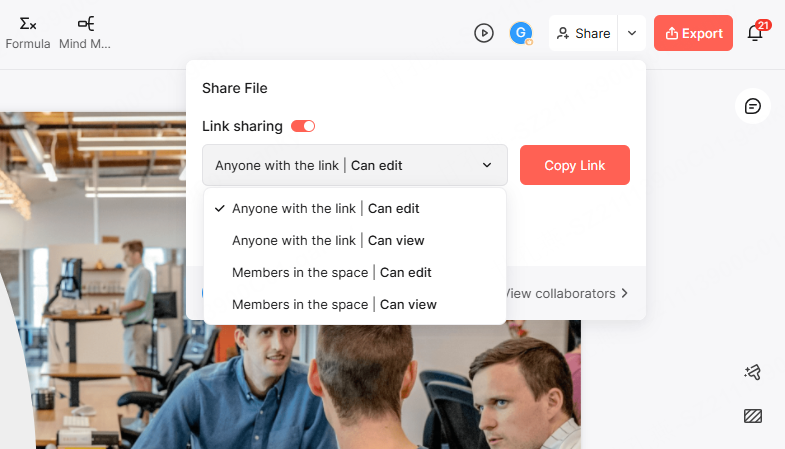
This step is not optional. Verify every data point, percentage, and citation against the original paper. Add figures and charts directly from the paper if the AI has generated placeholder versions. Adjust slide count and pacing for your exact time slot. Use an eligible paid plan for PPTX export, then inspect the file in PowerPoint if that is your delivery format.
For a deeper look at the PDF conversion mechanics, see our PDF to PPT guide for how Presenti handles document parsing and layout inference. If you are preparing a proposal defense rather than a conference paper, the same workflow applies — the research proposal defense templates provide a useful starting structure.
Preserve the qualification when you shorten a result
Imagine a small observational study of a training session. In this invented teaching example, 18 of 30 participants complete a follow-up task before training, while 24 of the same 30 complete it afterward. The recorded completion rate changes from 60% to 80%—a difference of 20 percentage points. That calculation alone does not show that the training caused the change.
A misleading slide title would be “Training improves performance by 20%.” It confuses a percentage-point change with a relative change, turns completion into a broader performance claim and asserts causality. A more faithful title is “Task completion was higher at the second observation.” Put “18/30 before; 24/30 after” beside the visual and identify the task and observation times.
The method and limitation should travel with the finding. If there was no comparison group, state that near the result rather than hiding it in an appendix. Explain that other differences between the observations may matter. In a real paper, retain the reported uncertainty, missing-data treatment and any paired analysis; these illustrative counts are not a substitute for them.
The appendix can hold the fuller task definition and supporting analysis so you can answer questions without squeezing them onto the main slide. If the presenter cannot explain how a figure was calculated, the response is to return to the paper or analyst, not ask the slide generator to supply a plausible explanation.
When drafting in Presenti, provide the proposed title, counts and qualification together. Compare them after any summarization: “higher at the second observation” must not quietly become “proved effective.” Keep the original paper reference beside the result, and use its actual figures only when you have permission to reproduce them.
Design Principles for Research Presentation Slides
A well-structured research paper to slide template can still be undercut by poor visual execution. Five design principles apply specifically to academic research presentations.
1. One finding per slide.
Each results slide should present and support exactly one finding. Multi-finding slides require the audience to do analytical work while listening — they will do neither well. A finding that deserves two minutes of discussion deserves its own slide.
2. Replace tables with charts wherever possible.
A table from the paper showing 15 rows and 6 columns becomes unreadable when projected. Identify the comparison or trend the table was designed to communicate, and render it as a bar chart, scatter plot, or line graph instead. Reference the full table in a footnote or appendix slide for those who want the detail.
3. Use figures from the paper directly.
If your paper contains figures that are already clear and well-labeled, import them into the slides rather than recreating them. Credit the source on the slide. This saves time and maintains data fidelity.
4. Minimal text — let the presenter speak.
Slide body text is an anchor for the audience’s attention, not a transcript of the talk. Keep bullets short enough to scan while preserving the qualifications needed to understand the claim. Longer explanations belong in your spoken delivery.
5. Consistent color and typography throughout.
A research presentation with five different font choices and three unrelated color palettes signals that the presenter ran out of time. Set a two-font, two-color system at the template level and do not deviate from it. A selected template provides a starting style. Check the actual figures, labels and slide layouts; applying a template does not complete the content or design review.
Frequently Asked Questions
How many slides should a research paper presentation be? Choose the slide count by rehearsing within the speaking time available. Account for questions separately and allow more time for complex figures than for brief transition slides.
What is the difference between a thesis defense and a conference presentation from a research paper?
A thesis defense is an assessment of the research and the researcher’s reasoning, with the format determined by the institution and committee. A conference talk introduces a contribution within a program set by the organizer. Ask for the local requirements: speaking time, question time and expected depth can differ substantially, so one fixed duration does not define either format.
How do I convert a research paper to a PPT without losing the argument?
The key is identifying the single most important claim in the paper — the central finding or contribution — and building every slide toward or away from that claim. Background slides exist to make the claim legible. Methods slides exist to make it credible. Results slides exist to demonstrate it. Discussion and conclusion slides exist to situate it. If a section of the paper does not serve one of those purposes in the presentation, it belongs in the appendix or the Q&A, not in the main deck.
What should the results section look like in a research paper PPT?
The results section should contain one to three slides, each presenting a single finding visually. Prioritize the finding that most directly supports the paper’s central claim. Use charts, figures, or annotated tables rather than bullet lists wherever possible. Do not try to present every result from the paper — conference audiences expect selectivity, not completeness.
Can AI accurately convert a research paper to a presentation?
AI tools can parse a paper’s structure, extract key sections, and suggest an outline and draft slides that need verification. The limitation is judgment: which findings to emphasize, how to frame the contribution for a specific audience, which prior work is worth mentioning versus cutting. A practical workflow is to let the AI handle the structural conversion and first-draft content, then spend your time on judgment-level decisions: reordering, cutting, reframing the contribution, and verifying data accuracy. Check whether the draft reduces work for your particular paper, including the time needed to verify and revise it.
Conclusion
The gap between a finished research paper to PPT translation and a genuinely effective academic presentation is almost always a structural problem, not a content problem. The argument exists. The evidence is there. What is usually missing is a deliberate decision about what to cut, how to sequence, and what to lead with in a spoken format. The 11-part framework in this guide gives you a structure that works for most conference contexts. The AI workflow with Presenti AI gives you a faster path from PDF to first draft. What remains — and what no tool can automate — is your editorial judgment about what this audience, in this room, at this conference, most needs to understand about your work.
Start a presentation draft in Presenti from material you are allowed to use. Check the current plan’s input and export options, then compare the outline and slides with the paper before sharing.
For more practical guides on academic slide creation, visit the Presenti blog.