A weekly report template should tell stakeholders whether the work is on track, what changed during the week, what evidence supports that conclusion, and which decisions or actions are needed next. It should turn a weekly report presentation into a compact control system: progress, variance, risk, decision, owner, and date, rather than reproduce every task from a project tool.
This template fits project teams, department leads, agencies, sales teams, and cross-functional programs that need a recurring update. Adapt the depth to the audience. A working team may need operational detail, while executives usually need the result, implications, exceptions, and decisions.
What Should a Weekly Report Presentation Accomplish?
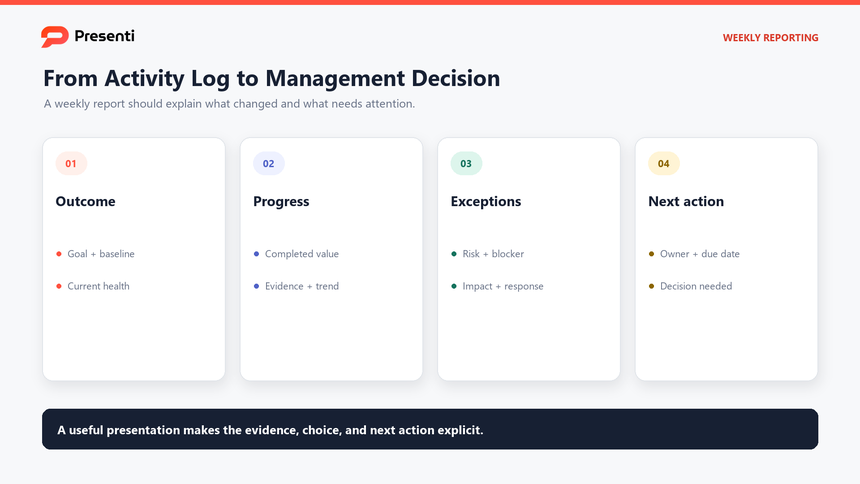
The presentation should reduce uncertainty before the next week begins. Start with a one-sentence status that combines the objective, current condition, and implication. For example: "The onboarding pilot remains on track for the October 2 expansion; completion improved from 68% to 81%, but the mobile verification defect must be resolved by Friday."
A weekly status report is most useful when its headline states the current health and the decision required.
That sentence is more useful than "the team made good progress" because the audience can see the goal, evidence, exception, and time-sensitive action. The rest of the deck should explain and support the headline rather than introduce unrelated updates.
| Audience question | Evidence to show | Action enabled |
|---|---|---|
| Are we on track? | Goal, milestone, current value, tolerance, and trend | Continue, intervene, or change scope |
| What changed? | Completed outcomes, variance, and important learning | Update the plan or preserve the current approach |
| What threatens the plan? | Risk, likelihood, impact, trigger, and mitigation | Escalate, fund, reassign, or accept |
| What happens next? | Priorities, owners, dates, dependencies, and decisions | Align the next week of work |
Define the reporting period and data cutoff on the first slide. A metric pulled Monday morning and a task list updated Friday afternoon do not describe the same state. Also name the audience and decision cadence so a forwarded deck still makes sense without the presenter.
Which Slides Belong in a Weekly Report Deck?
Most weekly updates need six to ten core slides. A short internal meeting may combine several jobs on one slide; a client or executive update may use separate slides for financial, schedule, and risk decisions. Keep the sequence stable from week to week so readers can compare change quickly.
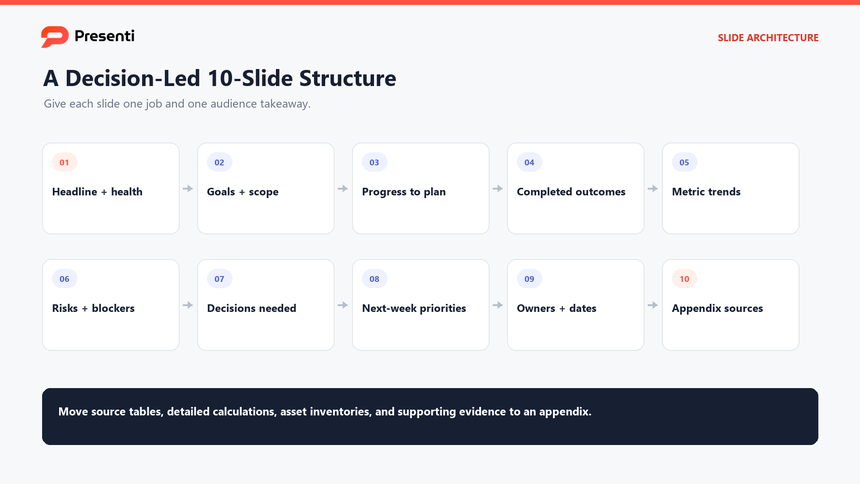
Build the slide sequence so the weekly progress presentation moves from evidence to owners and next actions.
- Headline and health. State the overall condition, most important change, and requested attention.
- Goals and scope. Restate the outcome, reporting period, and active workstreams.
- Progress to plan. Compare current milestones or metrics with the expected state.
- Completed outcomes. Show results delivered, not hours worked or meetings held.
- Metric trends. Use a small set of comparable leading and outcome indicators.
- Risks and blockers. Prioritize exceptions by impact and time to act.
- Decisions needed. Name the choice, options, recommendation, owner, and deadline.
- Next-week priorities. Limit the list to work that changes the project outcome.
- Owners and dates. Confirm responsibilities, dependencies, and review points.
- Appendix sources. Keep detailed task lists, calculations, and source tables available without crowding the main narrative.
Write message headlines rather than topic labels. "Data migration is two days late but does not affect launch" tells the audience more than "Timeline." Put the main claim in the headline, then use the visual and annotation to prove it.
How Do You Turn Activity into Progress and Insight?
Translate work into an observable change. "Held three customer interviews" is activity. "Three interviewees identified account setup as a barrier; none raised pricing" is a learning. "Revised the setup flow for a five-account test next week" is an owned response. A useful report connects all three without confusing activity with impact.
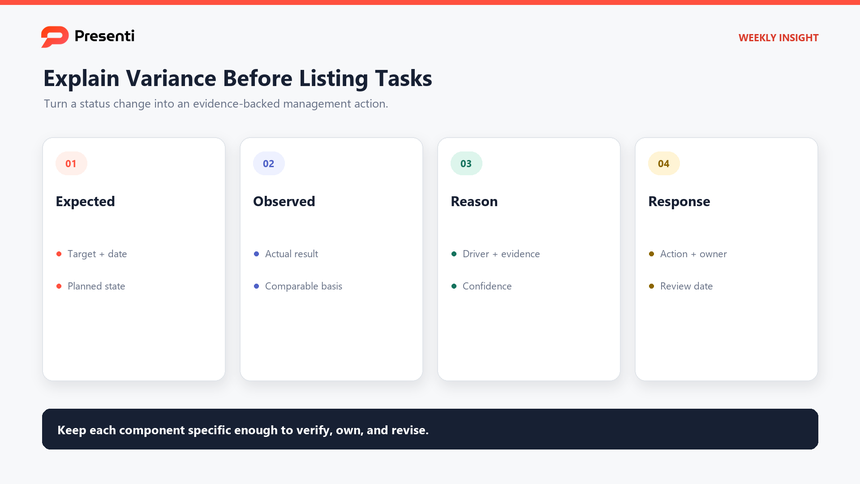
For every important variance, use four elements:
- Expected: the planned milestone, metric, or condition for the reporting date.
- Observed: the actual state measured with the same definition and period.
- Reason: the evidence-supported driver, with uncertainty stated when the cause is not confirmed.
- Response: the action, owner, timing, and check that will show whether the response worked.
Suppose a team expected 120 completed migrations but finished 94. Do not stop at a red status marker. Explain that 17 records failed a new validation rule, nine customers deferred their window, and the team has separated the technical issue from scheduling. That breakdown leads to two different actions and prevents a vague conclusion such as "migration is behind."
Use comparable denominators. If the customer base changed during the week, show both the count and the rate. If the metric is preliminary, label it. If a chart includes a forecast, distinguish it visually from actual values and state the assumption that drives it.
How Should You Present Metrics, Risks, and Decisions?
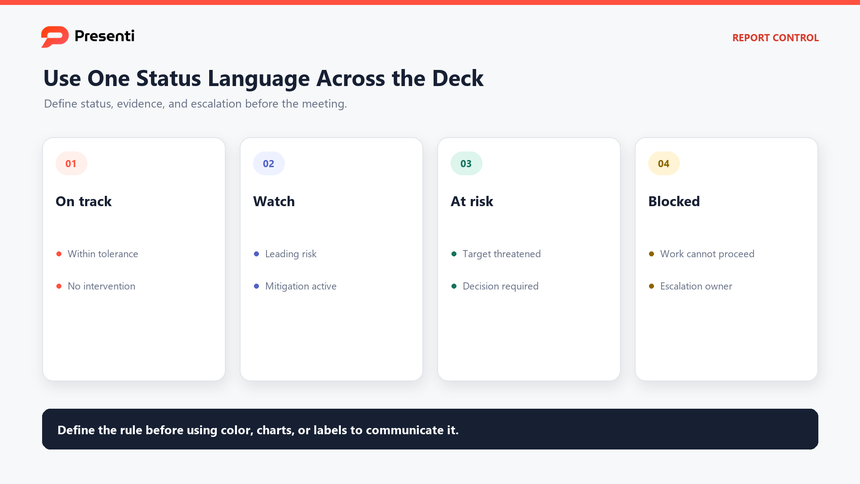
Use a consistent status language and define it before applying color. "Green," "yellow," and "red" are ambiguous when each workstream interprets them differently. A practical rule might be: on track means the target remains within agreed tolerance; watch means a leading risk exists but mitigation is active; at risk means the target is threatened and a decision is required; blocked means work cannot proceed without an external action.
Pair the status with evidence and a date. A yellow badge alone does not explain whether the issue is new, improving, or overdue. Show the trigger, current impact, mitigation, owner, and the date by which the status should change or escalate.
| Item | Weak reporting | Decision-ready reporting |
|---|---|---|
| Metric | Activation: 81% | Activation reached 81%, up 13 points from the comparable pilot baseline; source cutoff September 15 |
| Risk | Vendor delay - yellow | Vendor delivery is two days late; launch is unaffected unless approval slips beyond Friday |
| Decision | Need leadership support | Approve the fallback vendor by Tuesday if certification is not received Monday |
| Action | Team to follow up | Operations lead to validate fallback capacity by 3 p.m. Monday |
Make decision slides explicit. State the decision owner, deadline, recommendation, alternatives, and consequence of delay. If no decision is required, do not manufacture one; use a clear "for awareness" label. The point is to focus attention, not make every update sound urgent.
What Does a Practical Weekly Report Example Look Like?
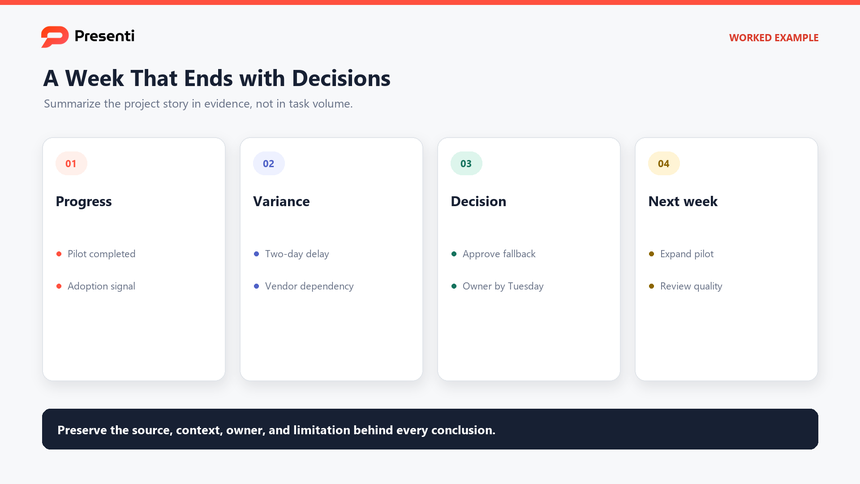
Consider a fictional customer onboarding pilot with a goal of reducing time to first value. The deck opens with: "The pilot remains on track for expansion; completion rose to 81%, one mobile defect affects 6% of users, and leaders need to approve the fallback verification method by Tuesday."
| Section | Example content | Evidence or action |
|---|---|---|
| Progress | Forty-two of 52 invited users completed onboarding | Comparable completion rate rose from 68% to 81% |
| Learning | Most abandonment occurs during identity verification | Event data and five support cases show the same step |
| Risk | Mobile camera defect affects three users | Fix in test; fallback upload is ready for approval |
| Decision | Approve fallback if the patch misses Monday validation | Product director owns the Tuesday decision |
| Next week | Expand to 100 users after quality review | Operations lead checks completion and support rate Friday |
This example separates outcome, evidence, issue, decision, and next action. It also avoids claiming that the redesigned flow caused the entire improvement; other factors may have changed. The appendix should retain the metric definition, event query, test population, and issue details so a reviewer can validate the summary.
Do not carry unresolved items forward as identical bullets. Show whether the condition improved, worsened, closed, or changed ownership. The weekly report should make movement visible.
How Can Presenti Turn a Weekly Update into an Editable Deck?
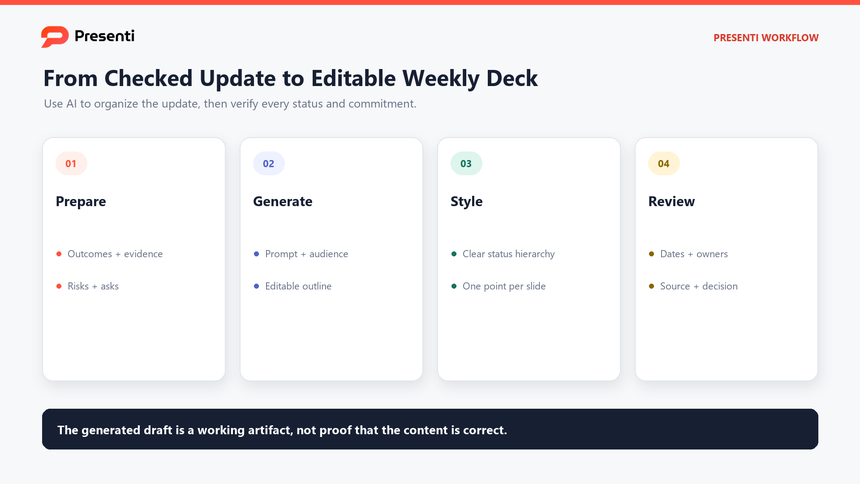
Presenti can help organize a checked weekly brief into an editable presentation draft. Use text to presentation when the update already exists as structured notes. Keep the source concise: reporting period, audience, headline, goals, evidence, variance, risks, decisions, next priorities, owners, and dates.
To get a free starting point for a customized weekly report template, open Presenti, paste the checked update, review the generated outline, and choose a restrained style in the Presenti template center. The resulting editable draft can be adapted to the reporting cadence, metrics, risks, and decisions your team actually uses.
The useful division of work is simple. The team decides what is true and important; the tool helps structure and visualize that material. Presenti cannot determine whether a project is genuinely on track, validate a metric query, or commit an owner to an action.
Step 1: Prepare a decision-ready weekly brief
Collect the latest values from approved sources and use the same cutoff date. Remove duplicate task notes. Mark estimates, unresolved causes, confidential details, and decisions that still require approval.
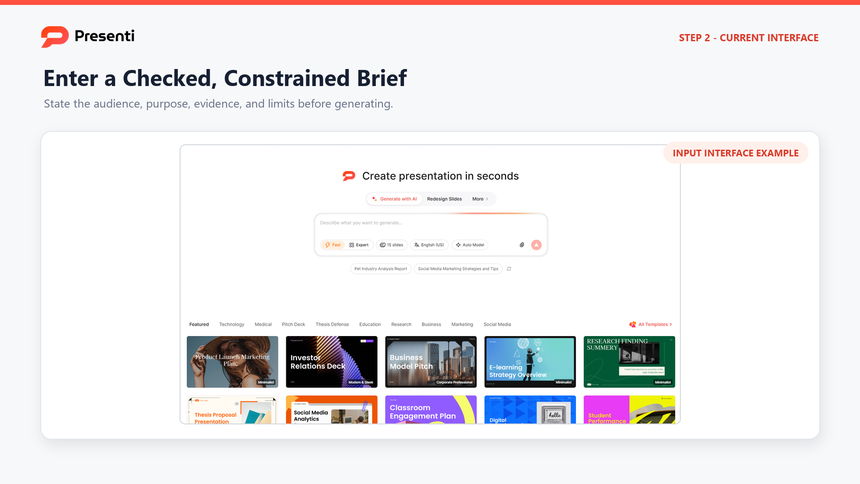
Step 2: Enter a constrained prompt
Use a prompt such as:
Create an 8-slide weekly project report for an executive review. Audience: product, operations, and support leaders. Period: September 9-15. Goal: decide whether to expand the onboarding pilot. Include the status headline, progress against plan, completed outcomes, two metric trends, one risk with trigger and mitigation, a fallback decision, next-week priorities, owners, and due dates. Use placeholders for unverified numbers. Do not invent causes, results, or commitments.
Step 3: Review the outline, then choose a weekly report template
Confirm that the outline begins with project health and ends with decisions and owners. Merge repetitive update slides, remove generic project-management advice, and move detailed task lists to an appendix. After the status story is clear, preview a template with readable metric, risk, and next-action layouts, then apply it to the draft.

Step 4: Verify the editable deck
Compare every value, date, and status with the source. Check chart periods and denominators, confirm that owners accepted the listed actions, and replace decorative visuals with evidence. Read the deck as a stakeholder who did not attend the working meetings.
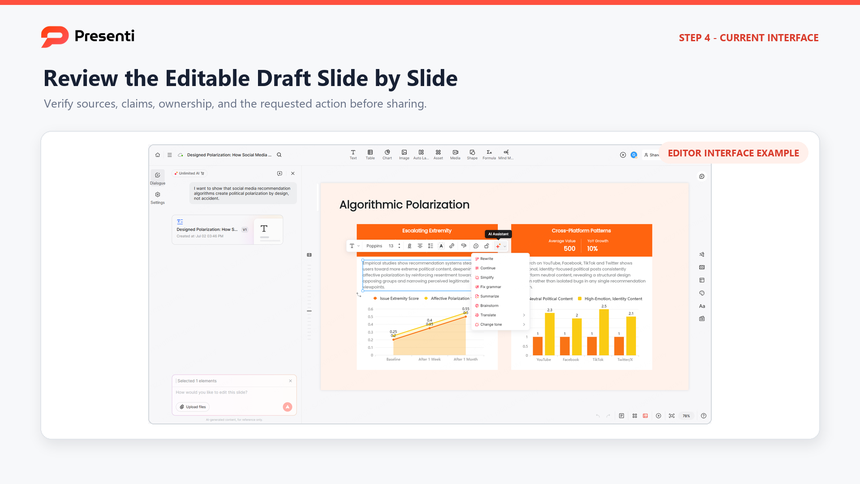
The final deck should shorten the status conversation and improve the next decision, not make incomplete data look polished.
Frequently Asked Questions
What should be included in a weekly report presentation?
Include the reporting period, objective, health headline, progress against plan, completed outcomes, important metric trends, risks or blockers, decisions needed, next-week priorities, owners, dates, and source notes.
How many slides should a weekly report have?
Six to ten core slides are usually enough. Combine sections for a short team update and use an appendix for detailed tasks, calculations, and source data.
What is the difference between a weekly report and a project status report?
A weekly report describes one reporting period and may cover a team, function, or project. A project status report focuses on project health across scope, schedule, budget, risks, and milestones. The formats often overlap, but the owner and decision should be clear.
Should every weekly report use red, yellow, and green?
No. Use status colors only when the team has defined what each state means. Evidence, thresholds, and the required response matter more than the palette.
How do you keep the report from becoming repetitive?
Keep the structure stable but update the story. Show movement since the prior period, close resolved items, explain changed conditions, and focus the main deck on exceptions and decisions.
Bottom Line
A strong weekly report template does not reward the team for producing more slides. It helps stakeholders understand current health, verified progress, meaningful variance, risks, decisions, and next actions quickly in a weekly report presentation. Use consistent definitions and source periods, make every exception actionable, and end with accepted ownership.