An annual report presentation condenses a year's results into a deck that a board, leadership team, employees, donors, or investors can understand in a finite meeting. It is not a slide-by-slide copy of the written report. Its job is to explain what mattered, what drove the result, what did not work, and what the organization will do next.
Use this template when you have an approved annual report, business review, or year-end data pack and need a clear presentation route. Start by choosing the audience and meeting goal. A board deck emphasizes oversight and decisions, an all-hands deck emphasizes shared context and priorities, and a public or investor-facing deck requires a different disclosure and review process.
What Audience, Year, and Headline Should Lead the Report?
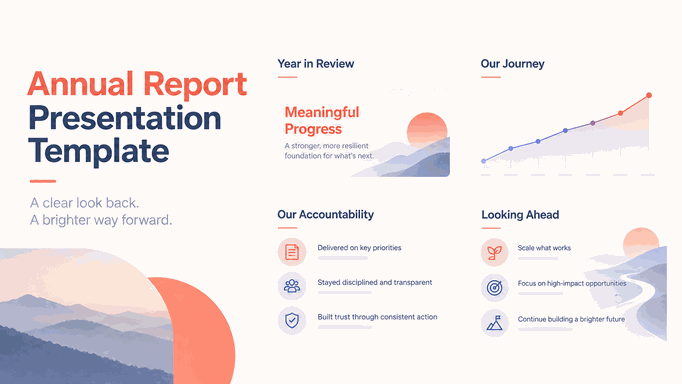
Before choosing charts, write one sentence that captures the year in business or mission terms. "We returned the core product to growth while reducing implementation delays" is a story. "2026 Annual Report" is only a label.
Set the frame in the brief:
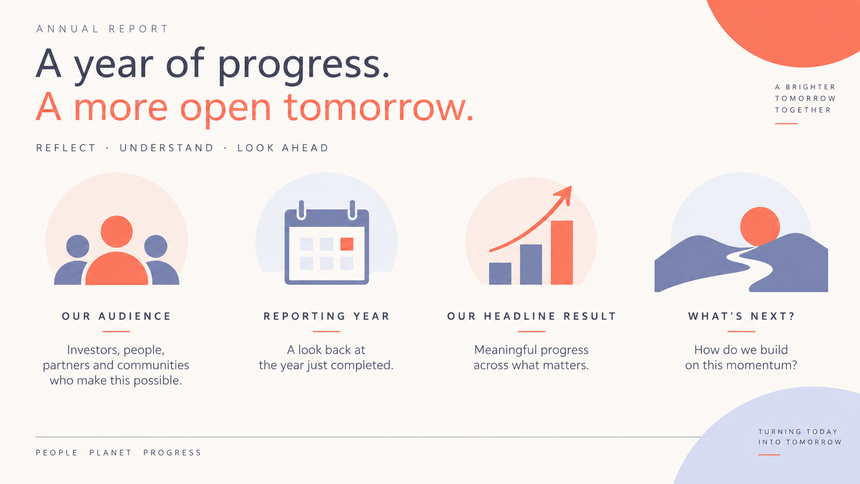
- Audience: Board, investors, employees, donors, customers, or a mixed group.
- Period: Fiscal or calendar year, comparison period, and any restated values.
- Purpose: Inform, approve, reassure, allocate resources, or set priorities.
- Decision: The choice or commitment the audience should make after the review.
- Disclosure boundary: What is approved for internal, partner, or public distribution.
Use the opening pages to orient the audience quickly. A cover, short leadership frame, and executive summary are usually enough before the evidence begins. Avoid opening with a dense table of contents or a decorative theme that delays the headline.
The summary should answer: what happened, why it happened, what is uncertain, and what changes next. It is the annual version of the logic used in an executive summary slide, not a list of every department's activity.
How Do You Build the Year-in-Review Story?
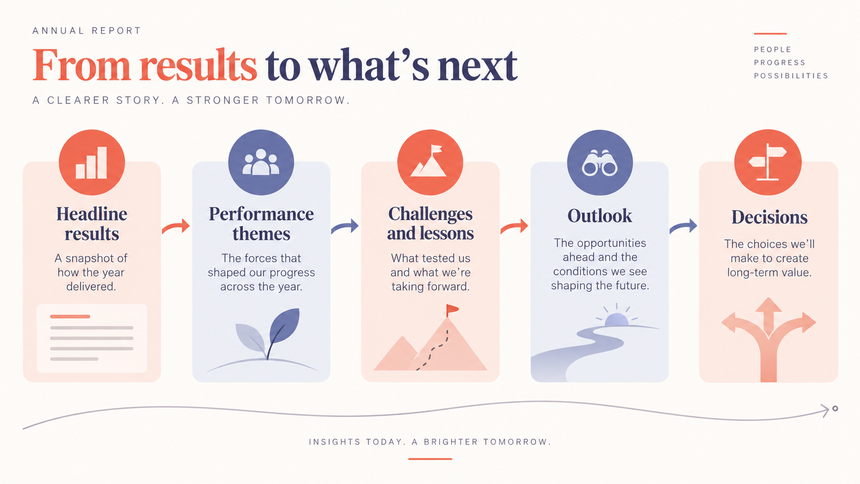
A credible annual report moves from headline to evidence to interpretation. Organize the middle of the deck around a small number of themes rather than a department-by-department status walk.
| Section | Question answered | Useful evidence |
|---|---|---|
| Year in numbers | What outcomes define the year? | Three to five approved measures with prior-year or target comparison |
| Financial or program performance | How did the main engine perform? | Revenue, margin, cost, delivery, participation, or mission measures that fit the organization |
| Customers, market, or community | Who experienced the result? | Customer growth, retention, reach, service quality, or segment mix with definitions |
| Milestones and capabilities | What changed the organization's ability to perform? | Product launches, systems, partnerships, people, or process changes |
| What did not work | Where did the plan miss or remain uncertain? | Variance, root-cause evidence, mitigation, and unresolved risks |
| Outlook | What will the organization do next? | Priorities, dependencies, measures, owners, and decision requests |
Give each theme one clear message. Use a title that states the conclusion, then show only the proof needed to support it. For example, "Enterprise adoption grew, but onboarding time remains the constraint" is more useful than "Customer metrics." Put supporting detail in an appendix or linked report.
Use a consistent comparison rule. Year-over-year, target versus actual, and prior forecast each answer different questions. Label the comparison and do not combine incompatible periods in one visual. If a definition changed, mark the break and show the comparable subset.
Which Charts Best Explain Annual Performance?
Annual reports often contain too many measures. Choose a chart based on the decision the slide supports, not on the chart types available in the editor.
| Question | Chart or visual | Review rule |
|---|---|---|
| How did a measure change over time? | Line or area chart | Keep the time axis continuous and label breaks or restatements |
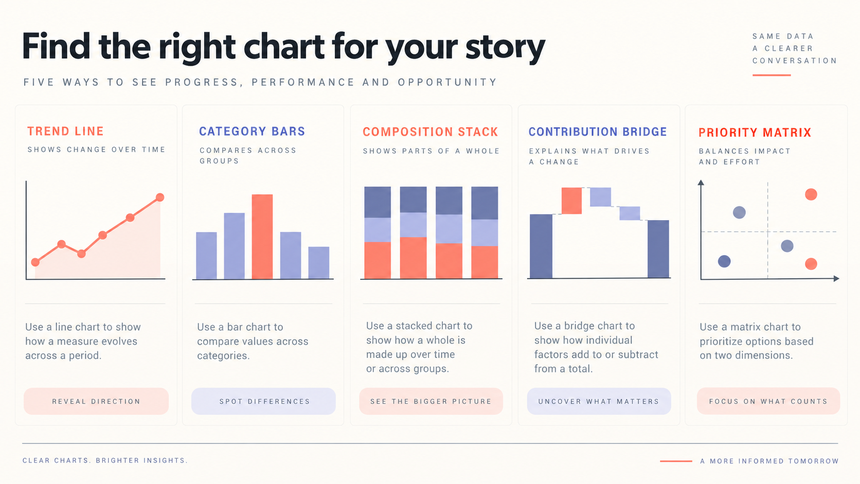
| How did categories compare? | Horizontal or vertical bars | Use a common scale and sort deliberately; long labels usually favor horizontal bars |
| How did a total split across groups? | Stacked bars or a carefully chosen composition chart | Keep the number of segments readable and explain the denominator |
| What drove a change from start to finish? | Waterfall or bridge | Define the starting and ending totals and reconcile every contribution |
| Where are the strategic priorities? | Matrix or roadmap | Define axes, criteria, timing, and owner before styling |
Use one main chart per slide when the message is important. If a dashboard is necessary, make the headline and hierarchy explicit so the audience does not have to choose the metric themselves. Add direct labels where they reduce back-and-forth. Keep colors stable across the deck so the same category does not change meaning from slide to slide.
Do not place a decorative area, funnel, or donut chart in the deck simply because it looks like an annual report. The chart should expose a relationship: change over time, comparison, composition, contribution, or priority. The data storytelling guide is useful when a chart needs a stronger explanatory sequence.
Every chart needs a source note, period, unit, and definition where ambiguity is possible. If values are preliminary or illustrative, say so in the visible slide or caption.
How Do You Show Challenges, Lessons, and Accountability?
A year-end deck gains credibility when it shows what did not go to plan. This does not mean listing every problem. Select the misses or uncertainties that change the audience's understanding of performance or the priorities ahead.
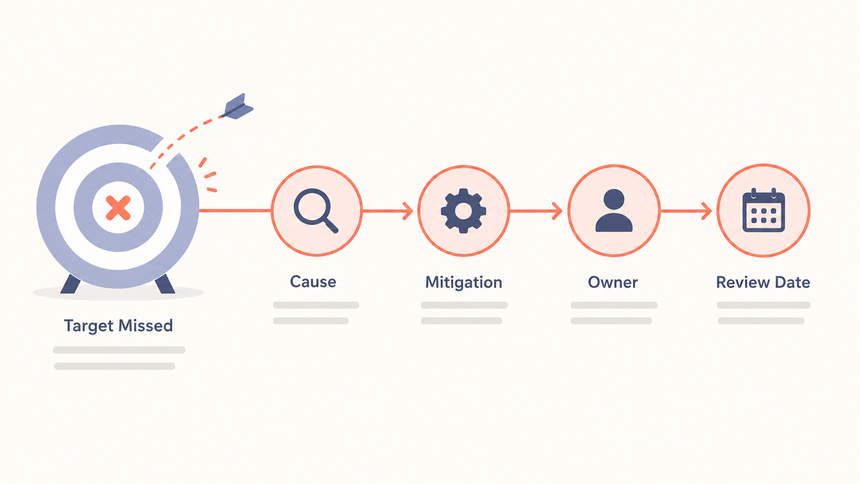
- What happened: State the variance or missed outcome with the original target and period.
- Why it happened: Separate evidence from a working hypothesis. Name what is known and what still needs testing.
- What changed: Describe the mitigation, decision, or process adjustment already made.
- What remains: State the risk, dependency, or unresolved question.
- Who owns the next review: Give the owner, timing, and measure that will show progress.
Do not use "lessons learned" as a generic heading with no consequence. Turn a lesson into a changed practice, an investment choice, a priority, or a metric. For example: "Implementation delays came from late source approval; next year's launch plan includes a named content owner and a two-week readiness gate."
Keep sensitive information within the approved distribution boundary. An internal board deck and a public annual report may use different evidence, definitions, and wording. Review every claim with the finance, legal, communications, or program owner who controls the source.
How Do You End with Outlook and Decisions?
The final section should make the next year concrete. Keep it short enough that the audience can remember the priorities after the meeting.
| Outlook element | Weak version | Decision-ready version |
|---|---|---|
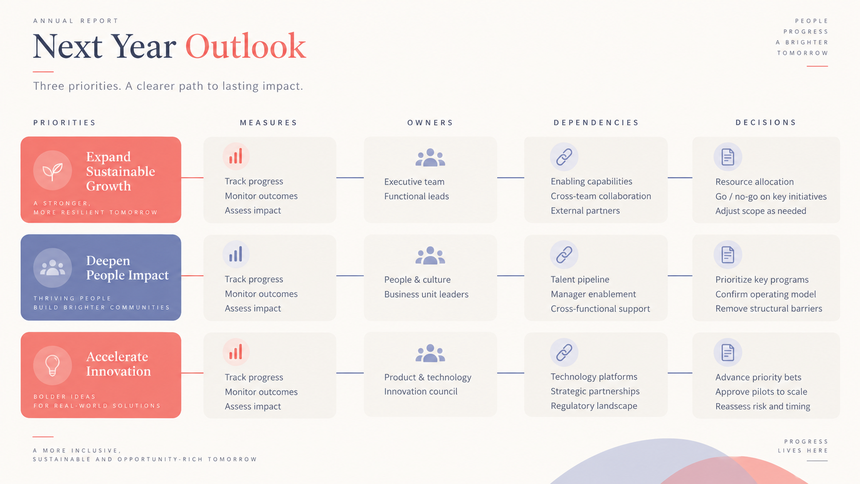
| Priority | Improve customer experience | Reduce first-value time for the top two onboarding paths |
| Measure | Track progress regularly | Review activation and support contacts monthly against the approved baseline |
| Owner | The team | Named functional owner with an executive sponsor |
| Dependency | Work cross-functionally | Approve data access and staffing before the Q1 design sprint |
| Decision | Align on next steps | Approve the two priorities and review gate by the stated date |
Separate "what we will do" from "what we need from this audience." The first is a plan; the second is a decision. Include the timing and the evidence that will be used to revisit the plan. A roadmap can support the page, but it should not replace a clear statement of the outcome.
When the annual report is part of a recurring cadence, link the outlook to the next QBR or monthly review. Use the same definitions where possible so the next deck can explain movement instead of restarting the measurement conversation.
How Can Presenti Help You Draft and Review the Annual Report?
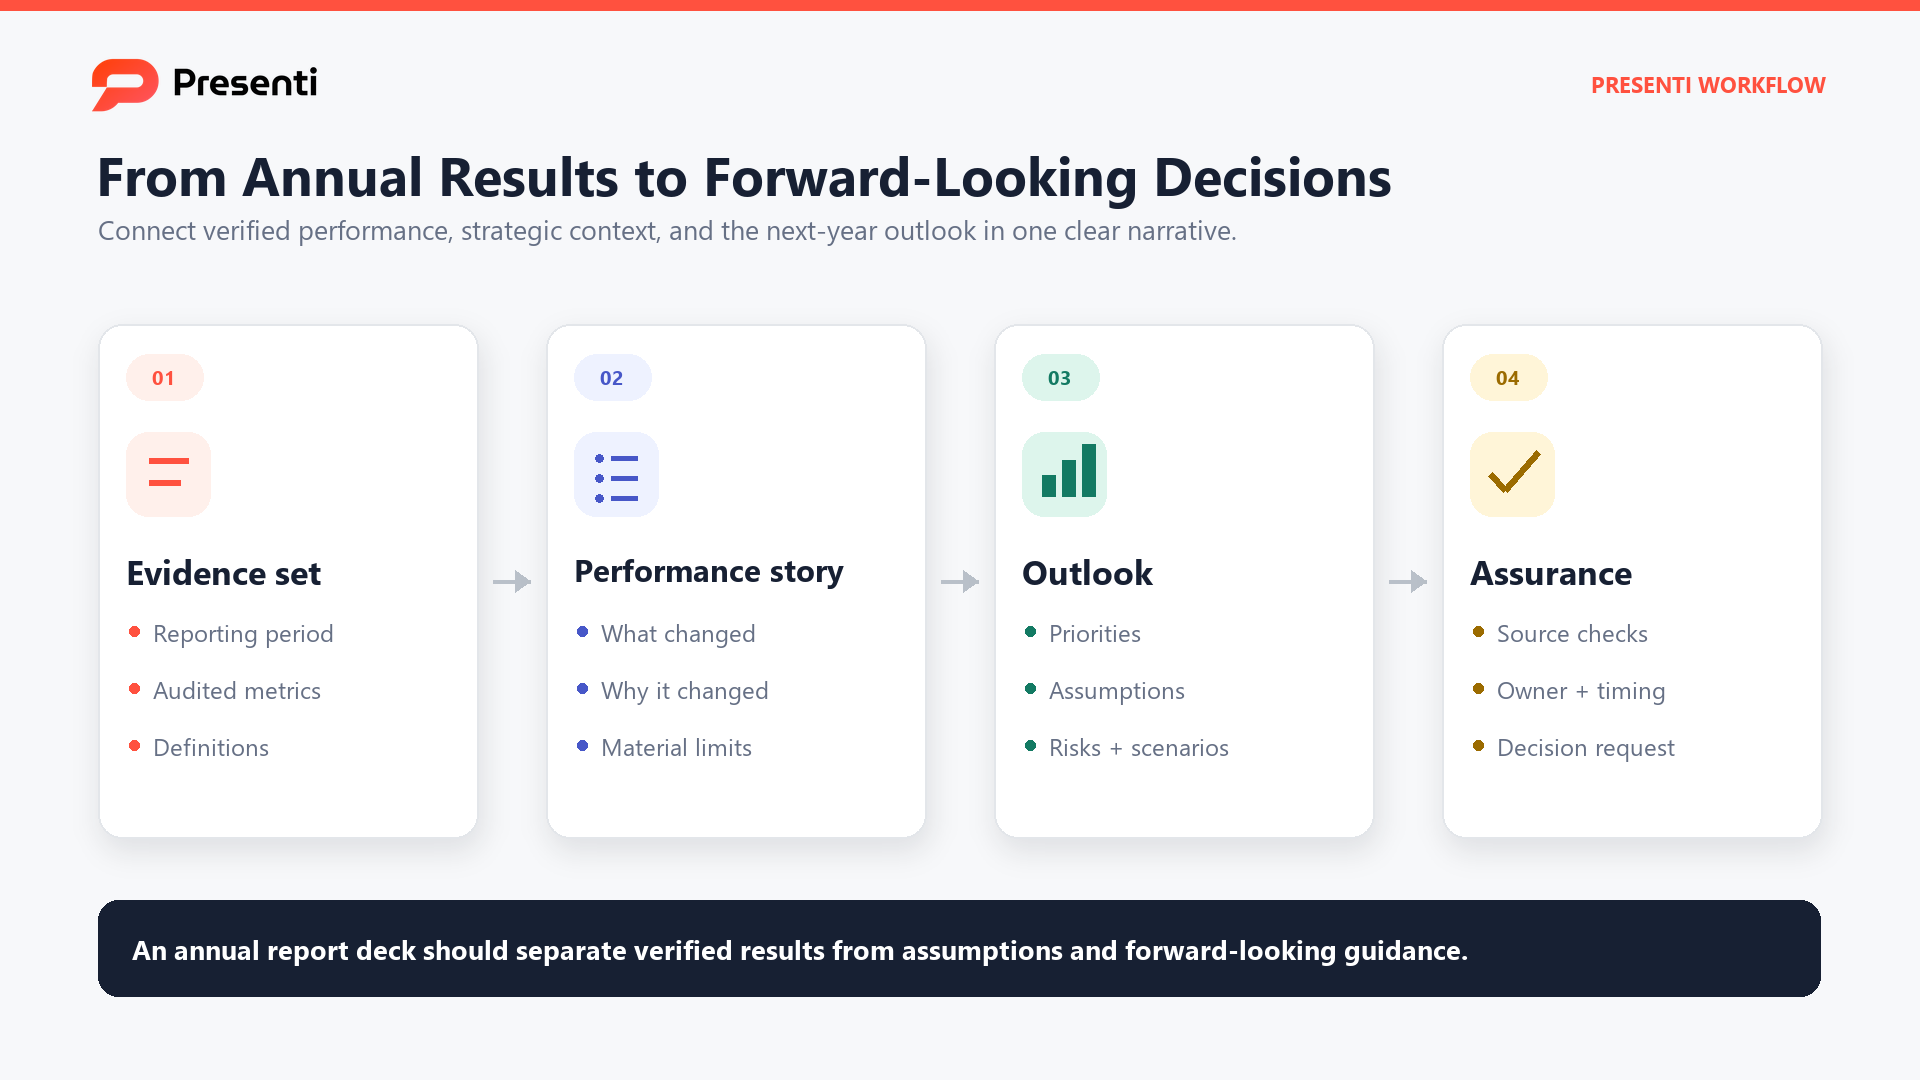
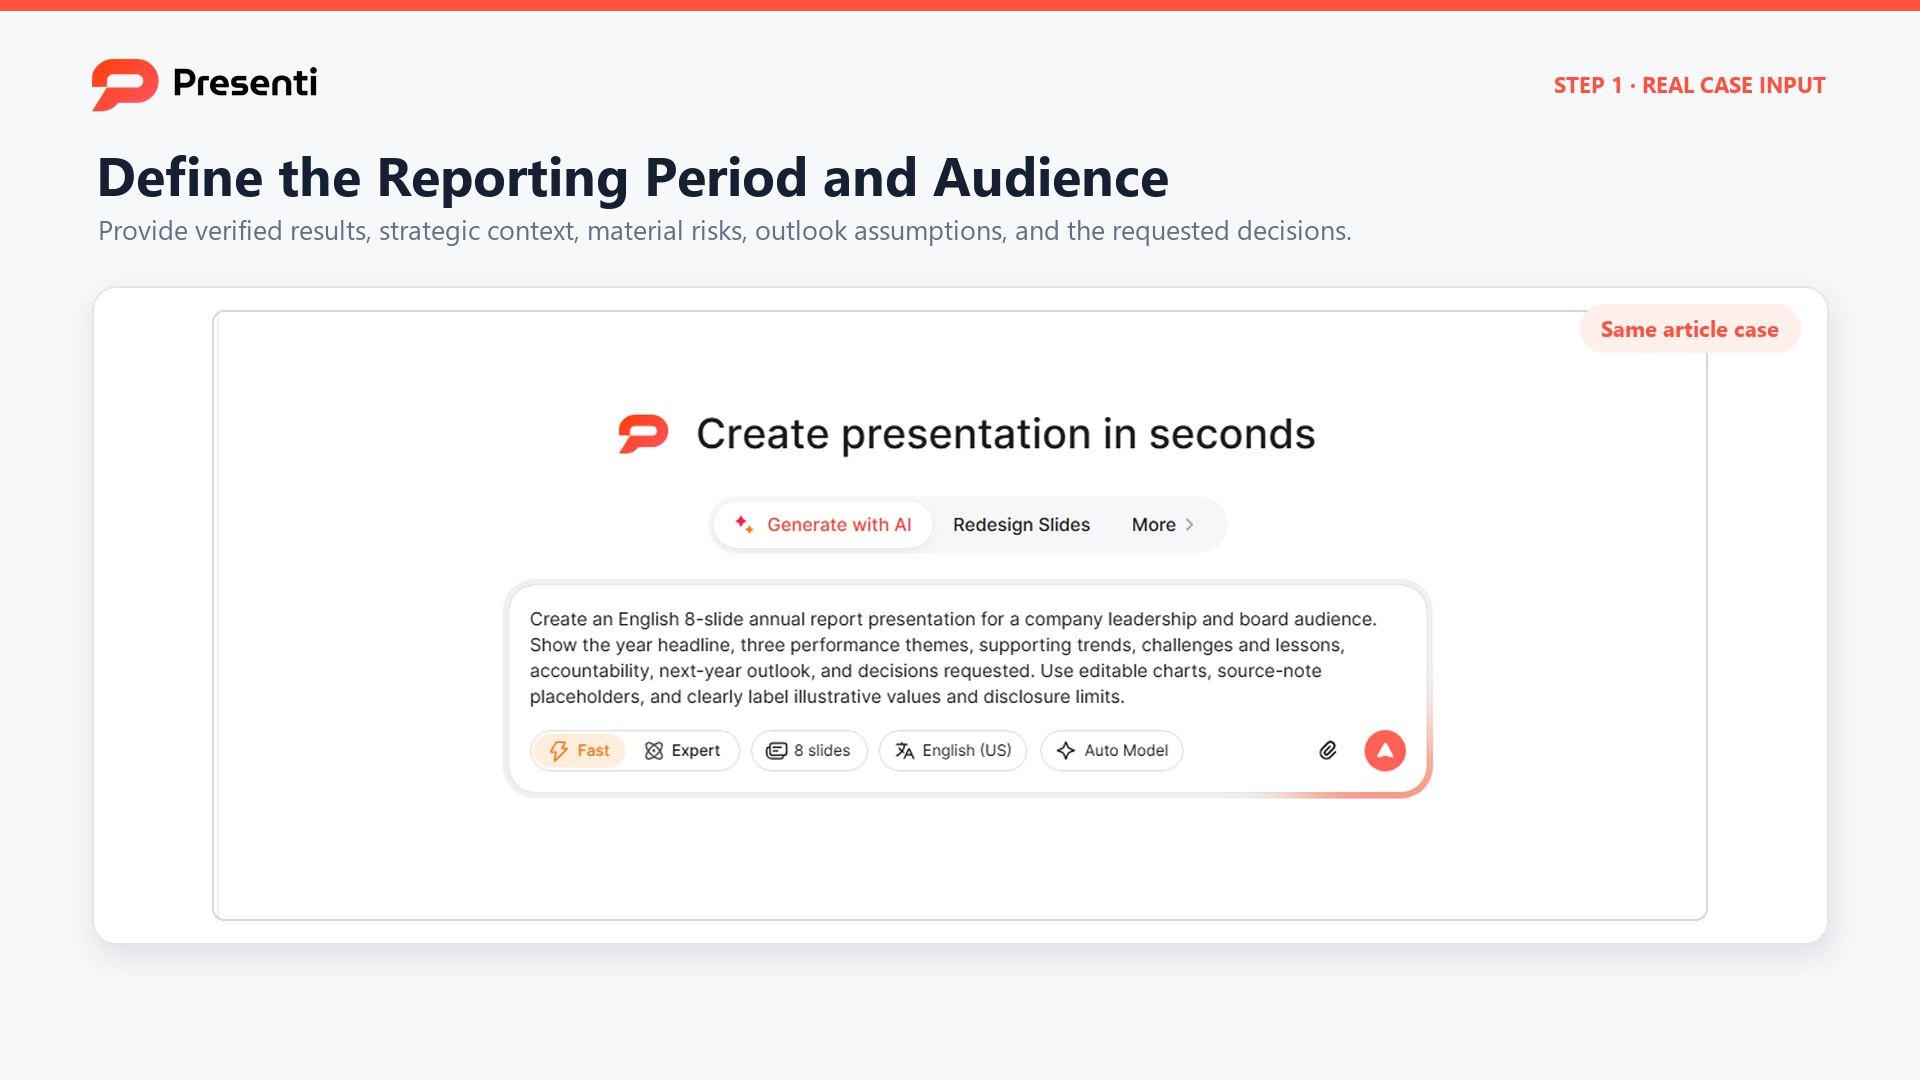
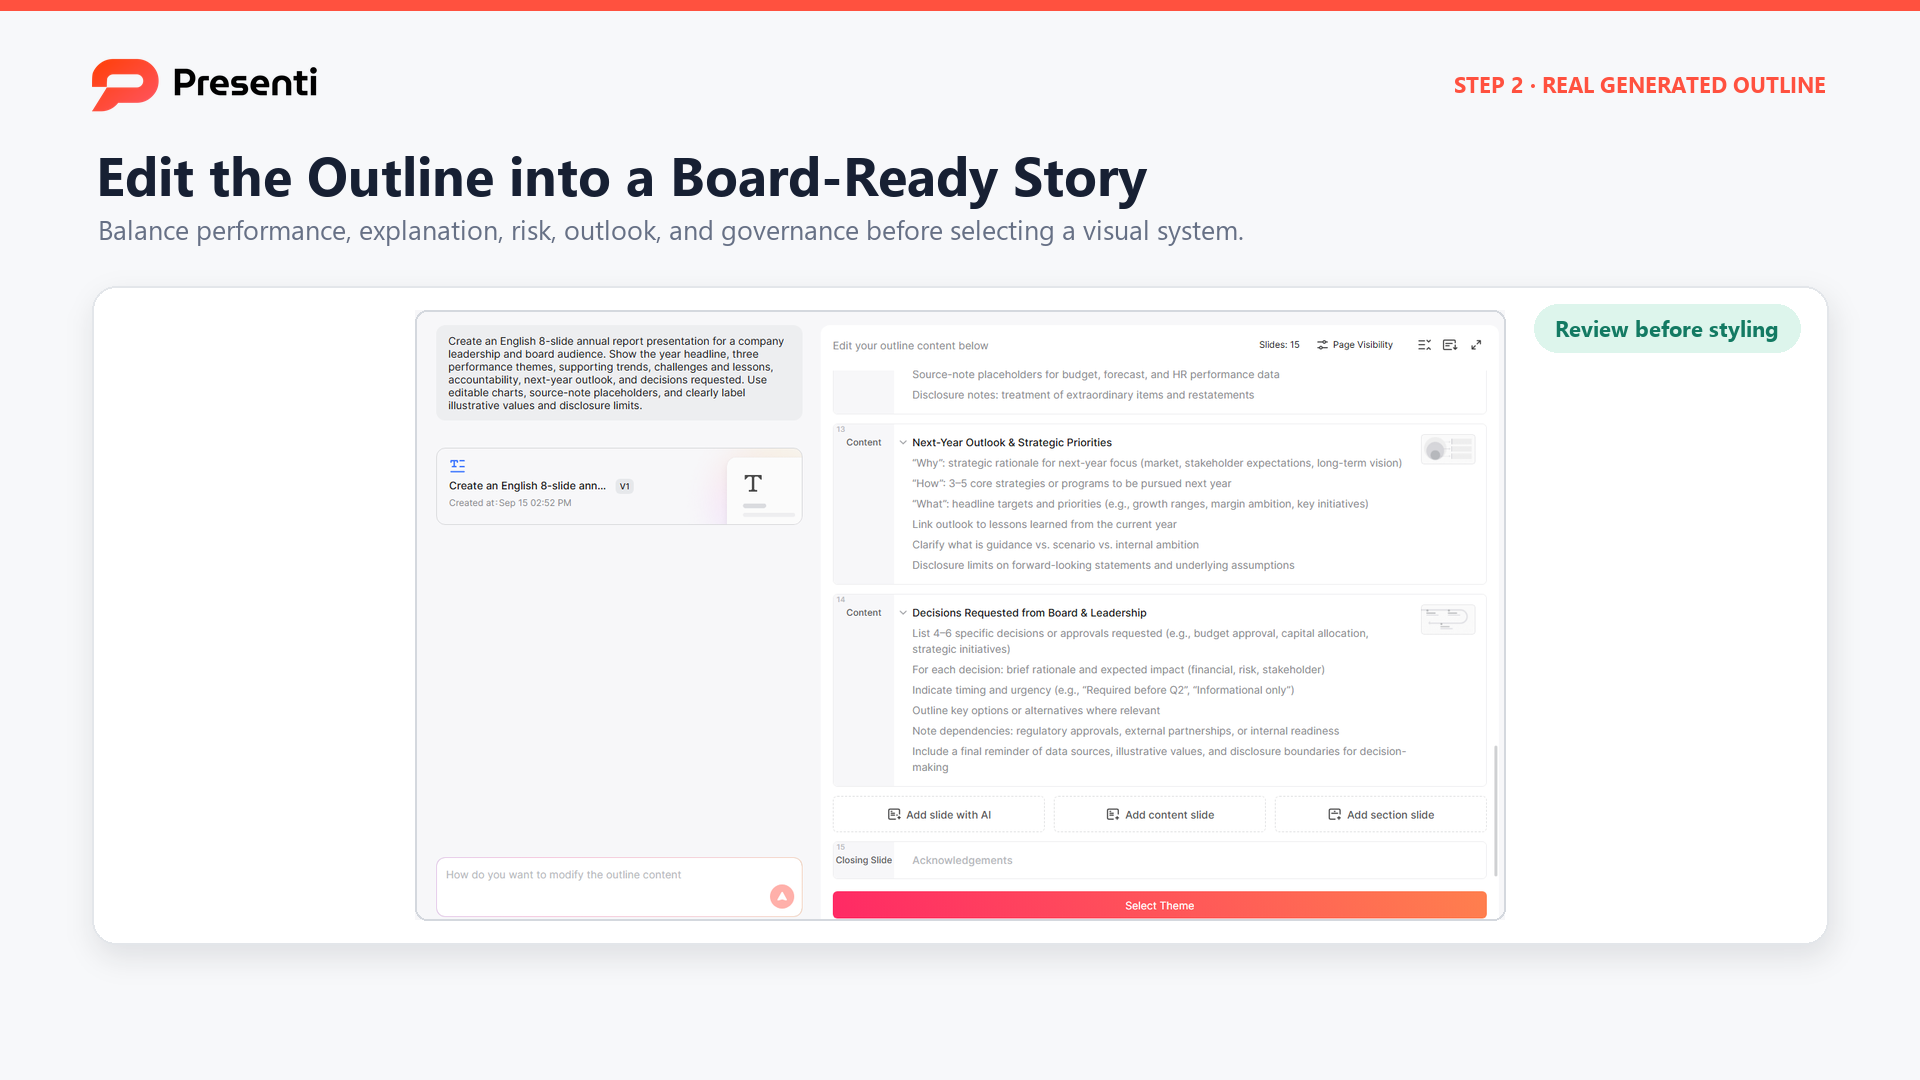
Prepare a brief with the approved annual report or data pack, audience, reporting period, headline candidates, trusted metrics, caveats, priority themes, and distribution boundary. Ask for an editable storyline and slide draft that keeps the executive path distinct from appendix detail.
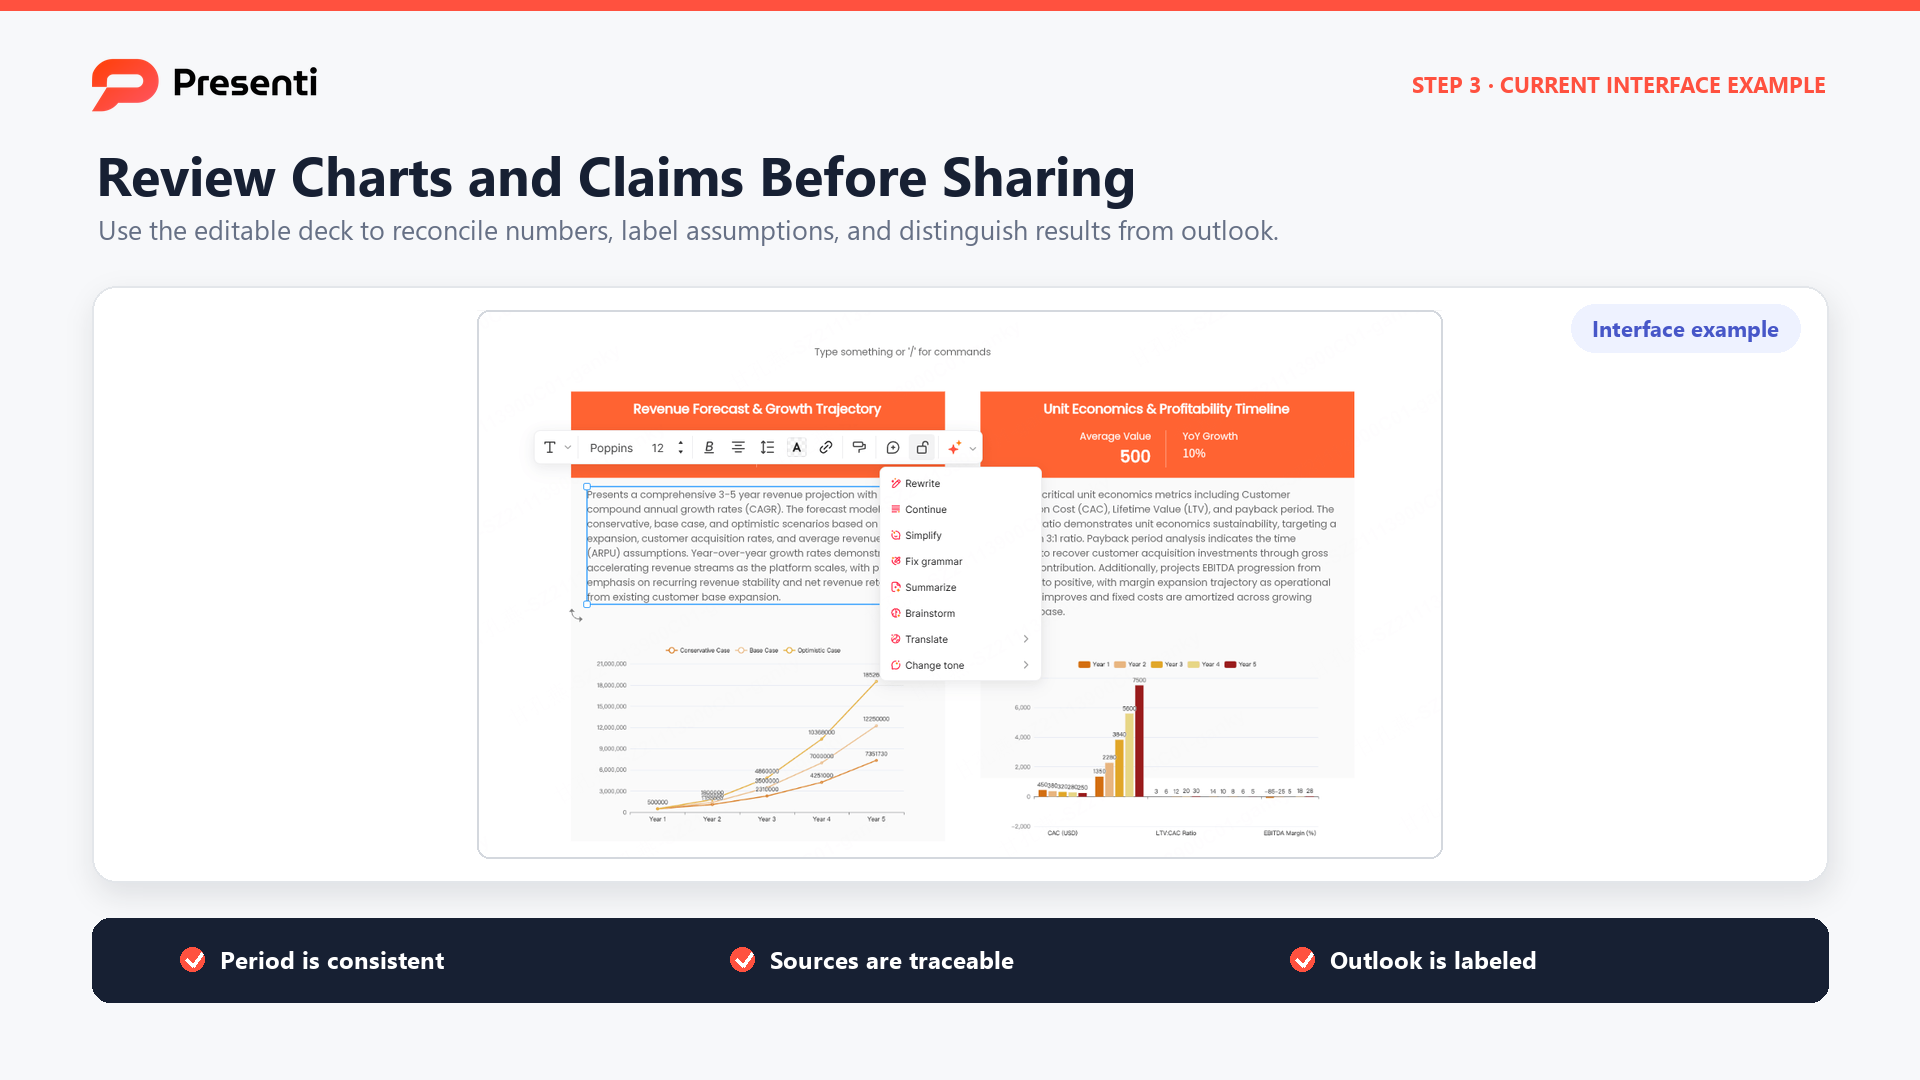
Review the result against the source in two passes. First check facts: period, units, definitions, calculations, comparisons, and disclosure. Then check the story: headline, evidence order, contrast, accountability, and outlook. Remove any generated interpretation that the source does not support, and add citations or source notes where a reader may question the number.
Presenti can accelerate the first draft, but it cannot decide which annual metrics are approved or whether a public claim meets your organization's reporting obligations. Keep a human owner for the final deck.
Frequently Asked Questions
How long should an annual report presentation be?
Use the meeting time and audience to set the length. A focused internal review may need 15 to 25 main slides, while a board or public event may need a different level of detail. Keep the main narrative concise and move supporting tables to an appendix.
What is the difference between an annual report and an annual report presentation?
The written report preserves detailed information and disclosures. The presentation selects the headline, evidence, lessons, and outlook that an audience can discuss in a meeting. It should be faithful to the report without reproducing every page.
Which metrics belong in the executive summary?
Choose the small set of approved measures that define the year's outcome for the audience. Include a comparison, unit, period, and source. Do not fill the summary with activity metrics that do not affect the decision.
Should an annual report presentation include challenges?
Yes, when challenges change the interpretation of performance or the outlook. State the variance, evidence, response, remaining risk, and owner. A selective, specific account is more useful than either a polished success list or a long issue register.
Can AI create an annual report presentation?
AI can help organize approved material into an editable draft, but a human must verify numbers, definitions, sources, disclosure boundaries, and conclusions. Treat generated content as a starting point, not as reporting approval.
Bottom Line
An annual report presentation should help its audience understand the year's defining result and make the next year's priorities concrete. Lead with a real headline, use a few consistent evidence themes, explain misses and lessons, and close with owners, dependencies, measures, and decisions. The deck succeeds when it turns a dense report into a trustworthy conversation about what changes next.