A sales forecast presentation should distinguish what the team wants to achieve from what the current evidence supports. Show the target, sales already completed, the remaining forecast, and the assumptions that could move the result. A large pipeline is not the same thing as a likely finish.
The example below follows one fictional quarter from a first review to a revised forecast. It uses bookings in thousands of US dollars, not recognized revenue or cash receipts. You can adapt the structure to your own measure, but do not mix those measures in one total. Once the numbers are agreed, turn the forecast brief into an editable slide draft; the calculation and commercial judgment should already be in your source material.

Open with three different numbers, not one optimistic headline
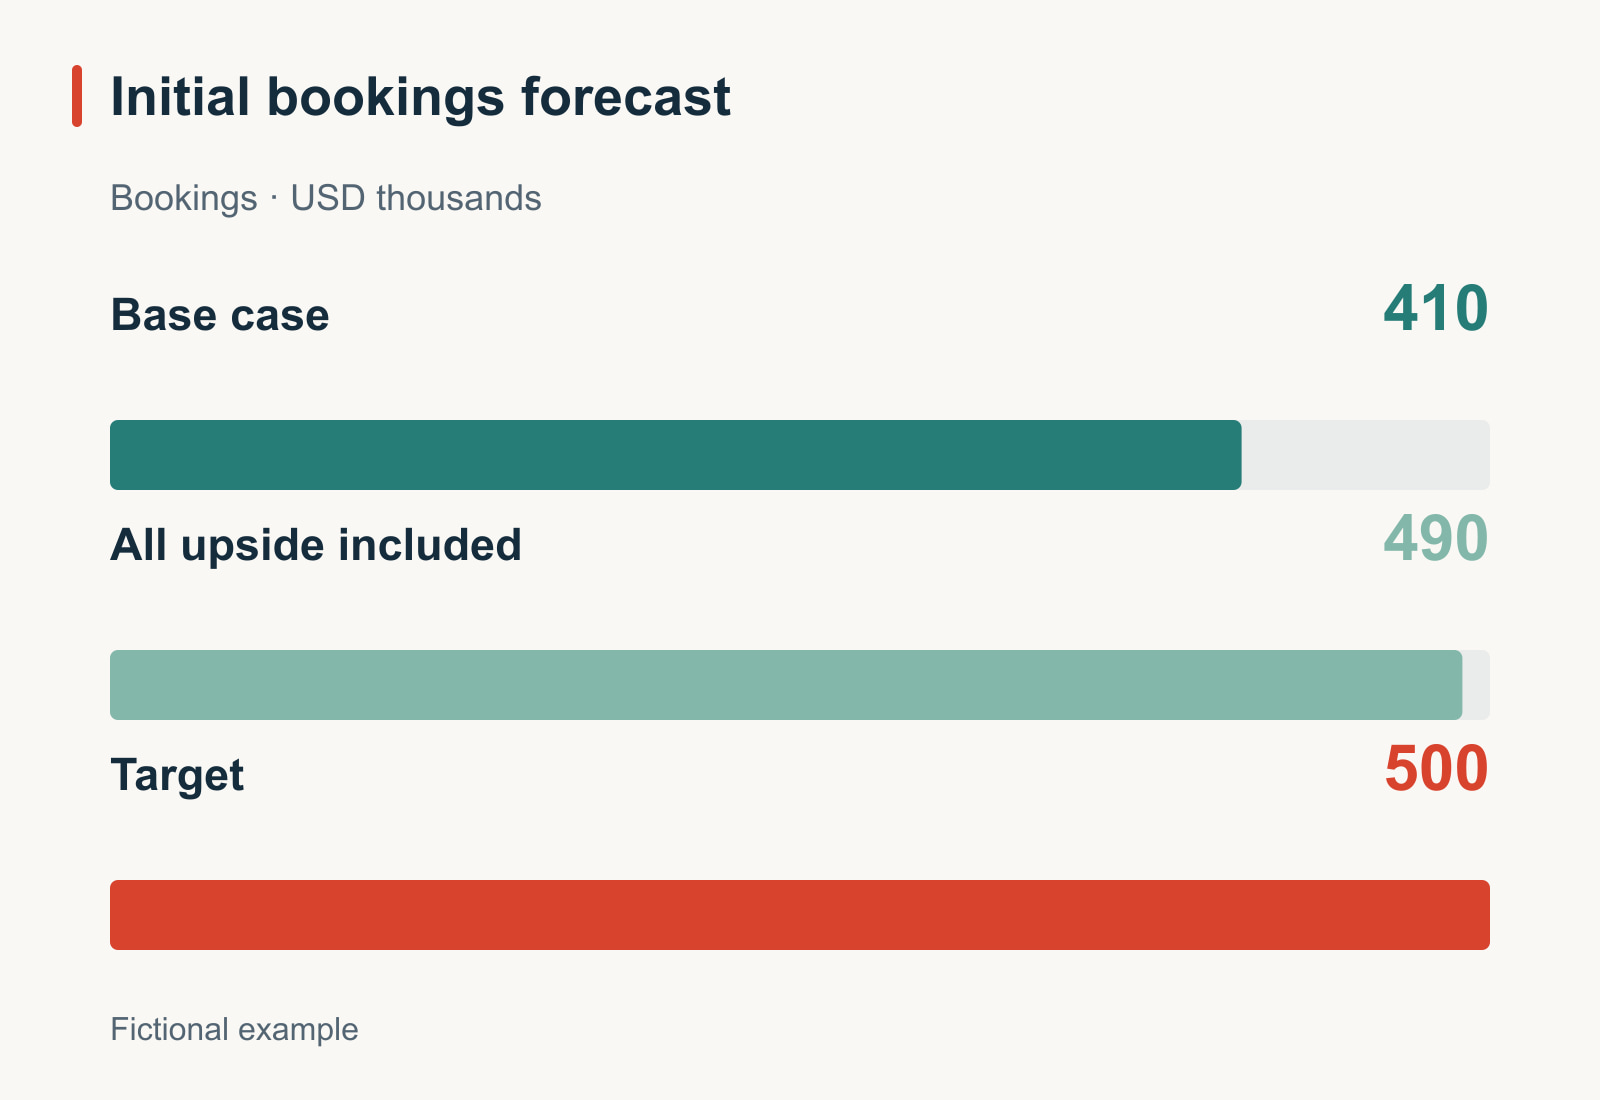
Suppose your quarterly bookings target is $500,000. You have closed $260,000 by the review date. The team expects another $150,000 from opportunities it believes can close before quarter-end. A further $80,000 is possible, but depends on unresolved decisions.
| Figure | Amount | What it means in this example |
|---|---|---|
| Quarterly target | $500k | The agreed goal, not a forecast input |
| Closed bookings | $260k | Completed business included once |
| Additional base-case bookings | $150k | Open opportunities selected for the expected finish |
| Base-case total | $410k | $260k closed + $150k additional |
| Additional upside | $80k | Not already included in the base case |
| Upside scenario total | $490k | $410k base case + $80k upside |
The opening message is: “The current base case is $410k against a $500k target; even the stated upside leaves a $10k gap.” That is more useful than “We have $230k of open opportunities.” It explains the expected result and prevents the audience from adding the target to the forecast.
Put the review date, quarter-end date, currency, and measure next to the chart. If one region reports annual contract value and another reports total contract value, reconcile them before combining the figures. A precise-looking total does not repair incompatible definitions.
Show which opportunities make the forecast believable
For a small review, use an opportunity table. For a larger portfolio, show the few opportunities that materially change the finish and put the full list in an appendix. The audience needs to see what must happen, not every CRM field.
| Fictional opportunity | Amount | Scenario treatment | Evidence still needed before quarter-end |
|---|---|---|---|
| North account | $90k | Base case | Customer signs the agreed commercial document |
| East account | $60k | Base case | Procurement confirms the purchase-order date |
| West account | $50k | Upside only | Budget owner approves the remaining scope |
| South account | $30k | Upside only | Customer completes the technical review |
| Central account | $120k | Excluded from this quarter | Customer's decision is scheduled after quarter-end |
North and East account for the additional $150k in the base case. West and South account for the $80k upside. Central is visible because it is commercially significant, but it does not belong in this quarter's forecast merely because it is large.
Use your team's established forecast categories, then define them on the slide. The labels “commit,” “best case,” and “pipeline” can have different meanings in different reporting systems. Find out whether a category includes lower categories or represents an exclusive bucket before you add them together.
A forecast review is also different from a sales funnel presentation. The funnel explains movement and conversion through stages. This forecast asks which specific business is expected to complete within the stated period. A healthy-looking funnel can still contain opportunities whose timing makes them irrelevant to the current quarter.
Explain a changed forecast with a bridge
At the next review, North has closed. That is good news, but it does not add $90k to the expected finish: the opportunity was already in the base case. Closed bookings rise from $260k to $350k while the remaining base-case amount falls by the same $90k.
Two other things happen. East's procurement date moves into the next quarter. West now has budget approval and joins the base case. South remains upside only.
| Change since the last review | Effect on this quarter's base-case total |
|---|---|
| Previous base-case total | $410k |
| North closes: open base case becomes actual bookings | $0 net change |
| East moves outside the quarter | −$60k |
| West moves from upside into the base case | +$50k |
| Revised base-case total | $400k |
The revised composition is $350k closed plus $50k of open base-case business. South adds $30k in the upside scenario, giving $430k. East has moved out of the period; it has not vanished from the account plan.
A bridge prevents two common presentation errors: celebrating a closed opportunity twice and leaving an opportunity in both base and upside after changing its classification. Keep an opportunity identifier in your underlying worksheet so a renamed deal is not counted as a new one.
Choose visuals that keep actuals and uncertainty apart
For the opening slide, show a solid $350k actual segment followed by a distinct $50k open base-case segment. Mark $400k as the base-case total. Show the additional $30k upside separately or as a clearly different extension, with $430k labeled as a scenario. Place the $500k target as a reference marker, not as another stacked segment.
Do not call $400k–$430k a statistical confidence interval. In this example, it is a pair of commercial scenarios, not a modeled probability distribution. A pattern, outline, or direct label should distinguish the scenarios even when the slide is viewed in grayscale.
Use a second slide for the change bridge and a third for the one or two decisions needed. If leadership asks to see every opportunity, open the appendix rather than shrinking a twenty-row table into the main slide.
If you use probabilities, say what they mean
A weighted pipeline can be useful, but it answers a different question from a selected-opportunity scenario. Multiplying a $100k opportunity by 60% gives a weighted contribution of $60k. It does not mean the customer will buy a $60k fraction of that contract.
Before putting a weighted figure on the same slide, explain where the probabilities come from, whether they include the chance of closing within this period, and whether the opportunity values use the same measure. An eventual win probability is not automatically a quarter-end close probability.
Do not add a weighted forecast to a base-case total built from the same opportunities. They are alternative views of overlapping business. If both are useful, put them side by side with their methods and explain why they differ. Where the probability inputs are merely judgment calls, present them as assumptions rather than measured precision.
End with a decision, not a command to close the gap
“Find another $100k” is a target instruction, not an explanation of the forecast. A useful discussion distinguishes actions that can change an opportunity from actions that only change the slide.
- East: ask whether procurement can realistically complete before quarter-end. Keep it excluded until timing evidence changes.
- South: assign an owner and date for the technical review. Keep the $30k in upside until the agreed base-case criteria are met.
- Management: decide whether the revised finish changes spending, staffing, or the next period's plan. Record that decision separately from the sales target.
Do not label these actions as guaranteed revenue. On the next review, show which assumptions changed and whether the forecast moved as a result.
Give the slide generator the calculation, not the responsibility for it
Prepare a brief containing the measure, review date, period, closed amount, mutually exclusive open categories, assumptions, and the exact totals. Remove customer-identifying information if it is not appropriate for the intended workspace or audience. Anonymized account labels are enough to explain this example.
Create a management presentation from the supplied forecast, using bookings in USD thousands. Current actuals are 350; additional base case is 50; upside adds 30; the target is 500. Base total is 400 and upside total is 430. Explain the change from the previous base total of 410: East moved out of the quarter (−60) and West joined the base case (+50). North closing changes composition, not the total. Show actuals and open assumptions differently. Do not invent probabilities, customer evidence, or additional opportunities.
After drafting, check the figures against the source worksheet and make sure the visuals preserve the distinction between closed business and conditional outcomes. Keep the definitions and assumptions readable. The point of the deck is not to make the forecast look certain; it is to help the audience understand what would have to change for the result to change.