A sales strategy template should explain how a team plans to reach a defined revenue outcome, not simply display a target. The useful sales strategy presentation connects the market focus, buyer problem, value proposition, selling motion, pipeline assumptions, team capacity, and measures that will tell leaders whether the plan is working.
This template is designed for a quarterly or annual planning meeting in which sales leaders, revenue operations, marketing, and executives need to agree on choices. It is not a prospect-facing sales pitch and it is not a weekly pipeline report. The central question is: which customers will we pursue, with which plays, and what evidence will trigger a change?

What Should a Sales Strategy Presentation Accomplish?
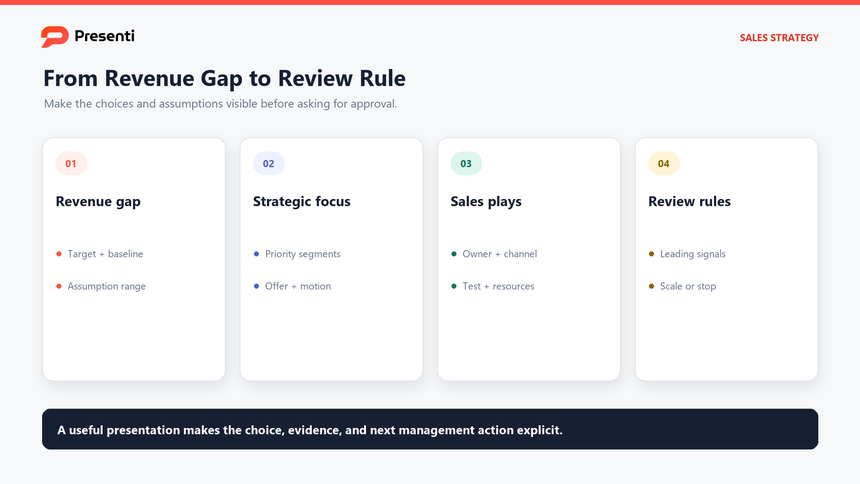
The deck should make a decision possible. Begin with the revenue or customer outcome, compare it with the current run rate, and show the few assumptions that explain the gap. A target without a model leaves the audience unable to judge whether the strategy is credible.
Write one decision sentence before building slides. For example: "To add $2.4 million in new annual recurring revenue next year, focus the mid-market team on two buyer segments, shorten discovery-to-proposal time, and test a partner-assisted play in the second quarter." The sentence includes an outcome, audience, choices, constraint, and time horizon.
| Question the deck must answer | Evidence to show | Decision expected |
|---|---|---|
| Where will growth come from? | Baseline, target, segment size, historical conversion, and capacity | Approve or change the growth assumptions |
| Who is the priority customer? | Ideal-customer criteria, buyer problem, win/loss pattern, and deal value | Select the segments to pursue or deprioritize |
| How will the team win? | Value proposition, sales motion, proof, channel, and enablement needs | Fund the selected plays and remove conflicting work |
| How will leaders know? | Leading indicators, outcome metrics, review cadence, and thresholds | Agree on continue, adjust, or stop conditions |
Keep strategy and reporting separate. Historical results provide the baseline, but the presentation must move from what happened to what the team will do differently. Use the sales funnel presentation template when the primary task is diagnosing stage conversion rather than setting the broader sales direction.
Which Slides Belong in a Sales Strategy Deck?
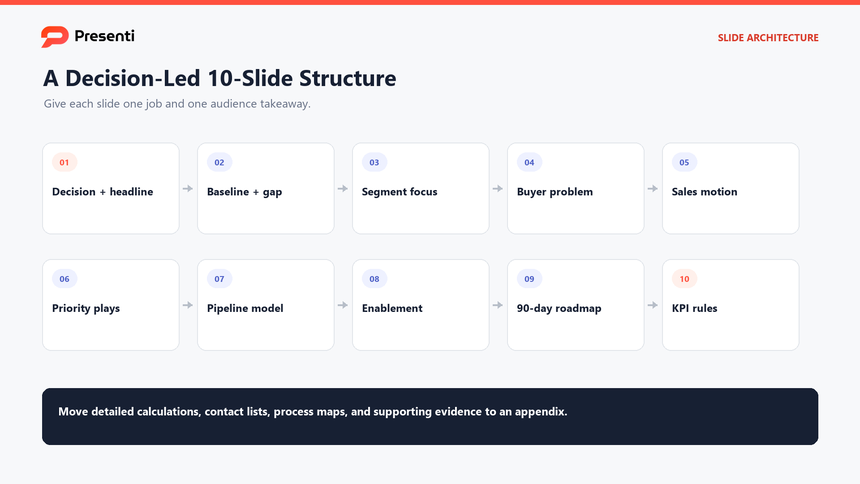
An effective deck usually needs nine to eleven slides. If the audience needs a broader sales plan presentation, keep the operating choices in the main story and move territory or account detail to an appendix. Use fewer when one audience already knows the market context; add an appendix when leaders need detailed territory, compensation, or account data. Each main slide should have one job and a headline that states the implication rather than the topic.
- Decision and headline. State the target, strategy, and approval needed.
- Baseline and gap. Compare current performance with the planning target and identify the assumptions.
- Market and segment focus. Show which customers matter, why they fit, and what the team will not pursue.
- Buyer problem and value proposition. Connect the selected audience to a defensible reason to act.
- Sales motion. Explain inbound, outbound, partner, product-led, enterprise, or blended routes and the trigger for each.
- Priority plays. Define two or three initiatives with an audience, message, channel, owner, and measure.
- Pipeline and capacity model. Show required opportunities, conversion assumptions, cycle length, coverage, and team capacity.
- Enablement and operating system. Name the content, coaching, process, data, and handoffs needed to execute.
- 90-day roadmap. Sequence milestones, dependencies, owners, and review points.
- KPI scorecard and decision rules. Separate leading indicators from lagging outcomes and state thresholds.
A sales strategy slide deck should make the decision legible, not turn into a competitor logo wall as the market slide or a CRM screenshot as the pipeline model. Summarize the evidence that changes the decision, then keep source detail in the appendix. The audience should be able to explain the strategy without reading every label.
How Do You Turn Revenue Goals into Sales Plays?
Start with math, then add behavior. If the team needs $2.4 million in new annual recurring revenue and the average first-year contract is $40,000, the model requires 60 wins. At a 25% opportunity-to-win rate, it needs about 240 qualified opportunities. That is a planning model, not a forecast; every input needs a source, range, and owner.
Break the gap into segments or motions that have different economics. Existing-account expansion, partner referrals, outbound acquisition, and inbound conversion should not share one assumed win rate. Show a base case and a downside case when the decision is sensitive to one uncertain assumption.
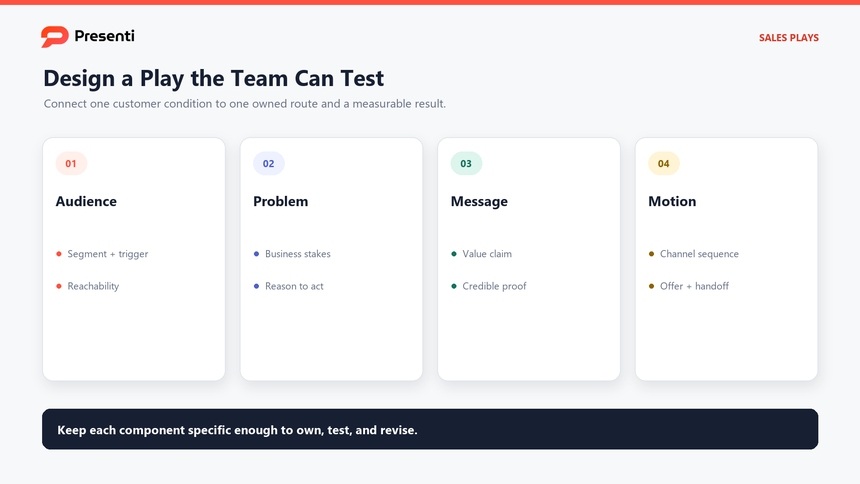
Translate the model into no more than three priority plays:
- Audience: the customer segment or account condition that triggers the play.
- Problem: the business situation the buyer is trying to change.
- Message and proof: the value claim and the evidence a representative can use.
- Motion: the sequence of touches, channel, offer, and handoff.
- Owner and resources: the person accountable and the content, data, or tooling needed.
- Test: the leading indicator, outcome measure, time window, and threshold.
A play called "improve outbound" is too vague. A testable version is: "For North American software firms with 200-1,000 employees that recently hired a revenue operations leader, run a six-week account-based sequence using the implementation-risk message and a peer proof point. Review reply quality, qualified meetings, and opportunity creation after the first 100 accounts."
How Should You Present Pipeline, Capacity, and KPIs?
Present the model so the audience can challenge it. Show the target, average deal size, required wins, win rate, qualified opportunities, sales cycle, and available capacity in one table. Put the source period next to every historical rate and label estimates as assumptions.
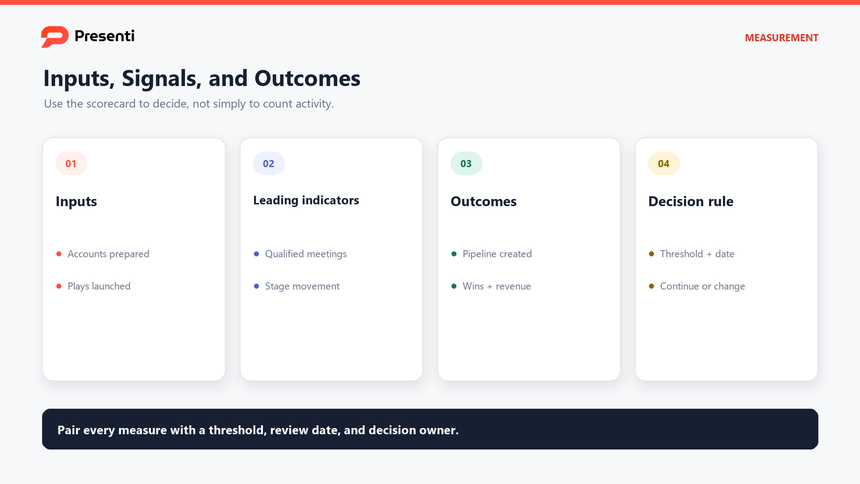
Separate three metric levels. Inputs show whether the play is running, leading indicators show whether buyer behavior is changing, and outcomes show whether the strategy created business value.
| Metric level | Examples | Management question |
|---|---|---|
| Inputs | Target accounts researched, plays launched, coaching completed | Did the team execute the planned work? |
| Leading indicators | Positive replies, qualified meetings, stage progression, sales-cycle movement | Is the play changing buyer behavior? |
| Outcomes | Pipeline created, win rate, new revenue, expansion, retention | Did the strategy create the intended result? |
Avoid presenting only activity counts. More calls may reflect more effort without better targeting. Pair a volume metric with a quality or progression metric. Likewise, do not treat pipeline value as revenue; explain probability rules and timing. When the data is thin, use a range and identify what evidence will narrow it.
What Does a Practical 90-Day Sales Strategy Example Look Like?
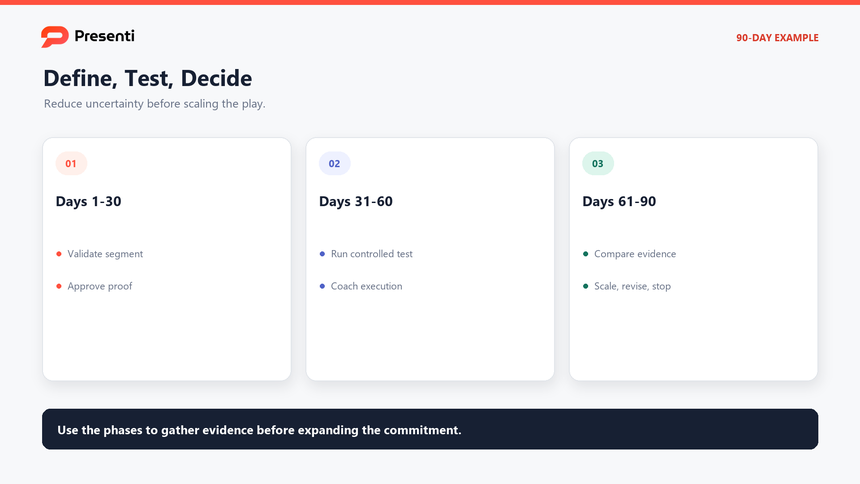
Consider a fictional B2B software team that needs to improve mid-market pipeline quality. Its first 90 days should reduce uncertainty before scaling spend.
| Phase | Work | Evidence | Decision |
|---|---|---|---|
| Days 1-30: define | Validate segment criteria, review wins and losses, write message, prepare proof | Account sample, interview themes, conversion baseline, approved assets | Approve the segment and the test design |
| Days 31-60: test | Run the play with a controlled account list and weekly coaching | Reply quality, meetings, objections, stage progression, execution consistency | Adjust audience, message, or motion |
| Days 61-90: decide | Compare the test with baseline and capacity assumptions | Qualified pipeline, cycle movement, cost, conversion range, seller feedback | Scale, revise, or stop the play |
Give each milestone an owner and a named review meeting. Use a decision rule such as: continue only if the play reaches the minimum qualified-meeting rate and at least two opportunities progress beyond discovery. The threshold should fit the sample size and economics; it is not a universal benchmark.
Show dependencies openly. If marketing must produce proof, operations must fix account data, or managers must coach a new discovery process, put those commitments on the roadmap. A strategy fails quietly when supporting work appears nowhere in the deck.
How Can Presenti Turn a Sales Brief into an Editable Deck?
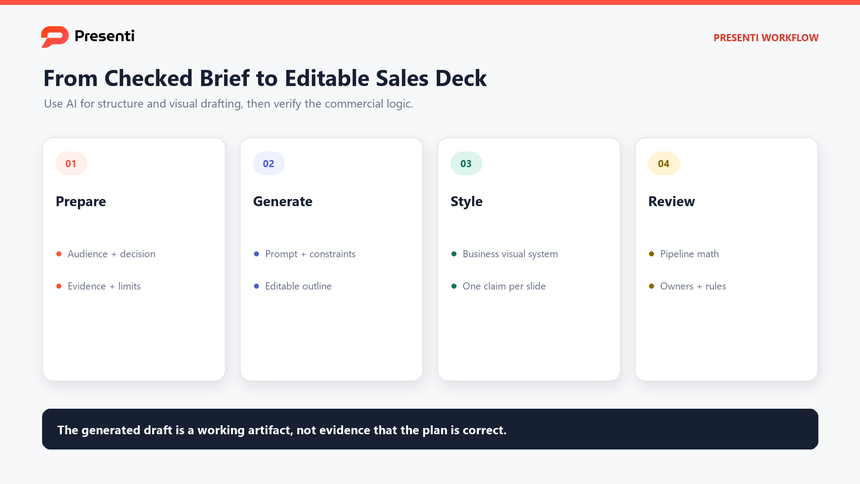
Presenti can help turn a structured sales brief into an editable first draft. Use text to presentation when the strategy exists as an outline or approved planning note. Word, PDF, and Markdown inputs can also be useful when the source is already documented, but clean the material first so obsolete targets and confidential account details do not enter the deck.
To try this outline as a customized sales strategy draft with Presenti's limited free AI allowance, open Presenti, paste the prompt, review the generated outline, and then choose a matching visual system in the Presenti template center. Review the draft against your targets, segments, and pipeline assumptions. Word/PDF imports and editable PPTX/PDF exports are listed on paid plans.
The tool is most useful after the team has chosen the audience, decision, evidence, and story. It can organize those inputs into slides and provide a visual starting point; it cannot validate revenue assumptions, judge account fit, or approve a sales plan.
Step 1: Prepare a decision-ready brief
Include the planning period, audience, target, baseline, priority segments, proposed plays, pipeline assumptions, resources, risks, and the decision required. Remove customer names and sensitive opportunity data unless their use is approved.
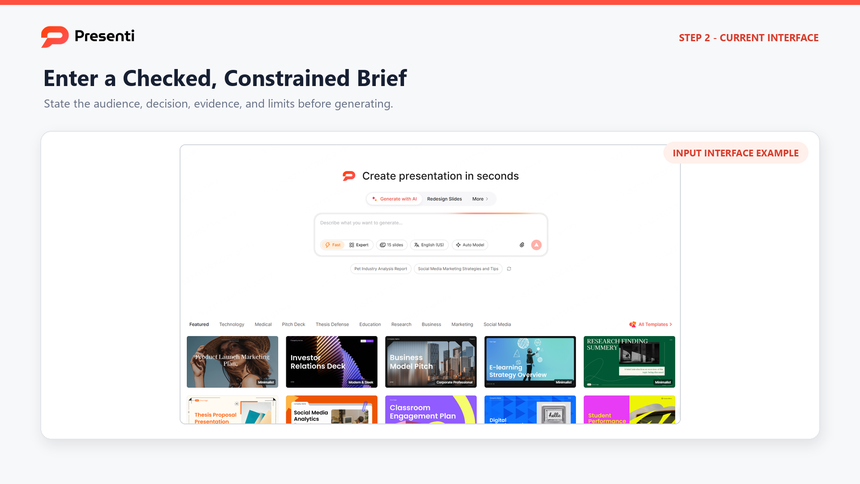
Step 2: Enter a prompt with explicit constraints
Use a prompt such as:
Create a 10-slide sales strategy presentation for an executive planning meeting. Audience: CRO, revenue operations, sales managers, and marketing. Goal: decide whether to focus next quarter on two mid-market segments. Include the revenue gap, segment choice, value proposition, three sales plays, pipeline assumptions, capacity, enablement needs, a 90-day roadmap, risks, and KPI decision rules. Use placeholders for unverified figures. Do not invent customer results or benchmarks.
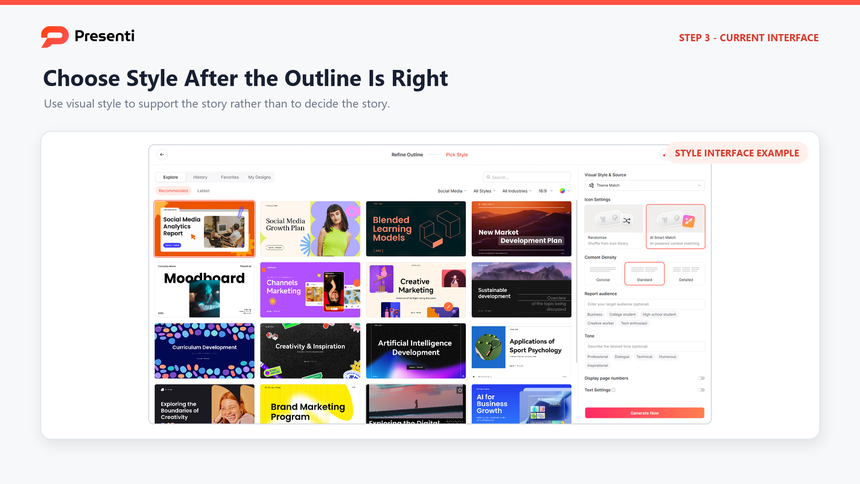
Step 3: Review the outline, then choose a sales strategy template
Check that the sequence moves from gap to choice to execution. Merge repetitive market slides, remove generic sales advice, and add a dedicated decision slide when the generated outline does not identify the ask. Once the story is correct, preview a restrained business template, check whether its chart and data layouts fit the evidence, and apply it to the draft.
Step 4: Verify the editable deck
Compare every figure with the source model. Check chart denominators, period labels, segment definitions, pipeline math, and ownership. Replace generic visuals with evidence that supports the decision, then rehearse the deck with the meeting time available.
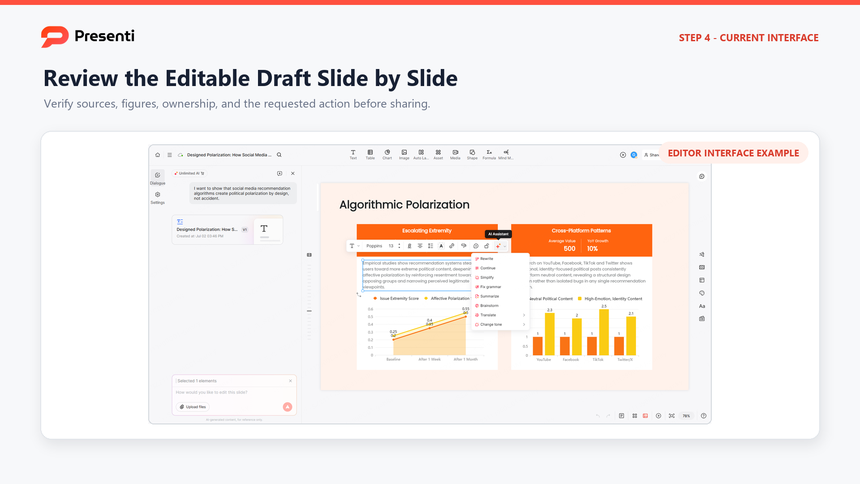
The completed deck should make the sales choices and review rules clearer, not make uncertain assumptions look finished.
Frequently Asked Questions
What is a sales strategy presentation?
It is an internal decision deck that explains how a sales team plans to reach a defined outcome through selected customers, positioning, selling motions, plays, resources, and measures. It is different from a buyer-facing sales pitch and a historical sales report.
How many slides should a sales strategy presentation have?
Nine to eleven core slides are usually enough for an executive planning discussion. Put account lists, territory detail, calculation tables, and supporting research in an appendix.
What is the difference between a sales plan and a sales strategy?
The strategy explains the choices about where and how to compete. The plan translates those choices into targets, activities, owners, timing, resources, and review rules. A useful presentation contains both but keeps the distinction visible.
Which KPIs belong in the deck?
Use a small set across inputs, leading indicators, and outcomes. Examples include play adoption, qualified meetings, stage progression, pipeline created, win rate, sales-cycle movement, and revenue. Choose metrics tied to the strategy rather than filling a generic dashboard.
How often should the strategy be reviewed?
Use a cadence appropriate to the sales cycle and decision. Review execution signals frequently, but avoid changing the strategy before enough evidence exists. State the review date and thresholds in the original deck.
Bottom Line
A strong sales strategy template turns a revenue ambition into an explicit set of choices and a decision-ready sales strategy presentation. Quantify the gap, select the priority customers, define a few testable plays, expose the pipeline and capacity assumptions, and agree on owners and decision rules. Use design to make those choices easier to evaluate, and keep every target and claim traceable to a source.