A good organization chart template turns a list of roles into a decision-ready view of accountability. It should answer who owns each function, who reports to whom, where decision rights sit, and how the team changes as the business grows. The chart is useful when it helps a reader make a staffing, onboarding, governance, or communication decision rather than merely admire a set of boxes.
This guide is for founders, people leaders, operations teams, and project owners preparing an org chart presentation for a new team, a reorganization, an onboarding session, or a planning review. It keeps current roles separate from proposed roles, distinguishes solid-line accountability from dotted-line collaboration, and ends with a reviewable editable deck workflow.
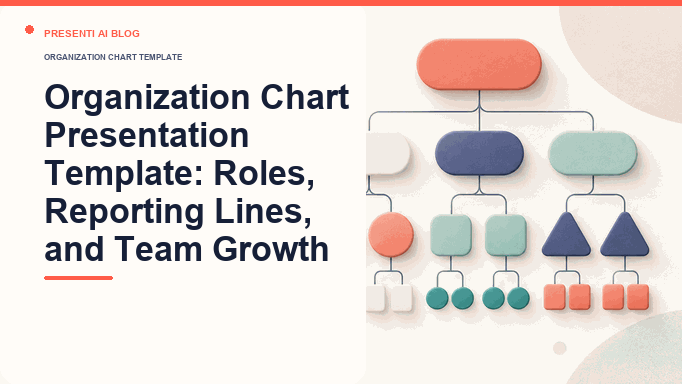
What Should an Organization Chart Presentation Decide?
An organization chart is a diagram of formal reporting relationships among roles, teams, and sometimes named people. Microsoft describes the common hierarchy layout as a way to show relationships such as department managers and non-management employees. That definition is a useful boundary: the chart should make accountability legible, while a separate process map or RACI can explain work handoffs and decision participation.
When a change affects several groups, pair the role map with a stakeholder communication plan that specifies which questions each group needs to discuss and who will respond.
Write the decision above the diagram. Examples include: "Which roles must be hired before the regional launch?", "Who approves a customer escalation?", or "How does the new product team connect to finance and legal?" A chart without a decision question tends to become a directory. A chart with a question can be scoped to the people who need to act and the level of detail they can actually read.
| Scope field | Question to answer | Example |
|---|---|---|
| Audience | Who needs to use the view? | New hires, executives, a project team, or a board |
| As-of date | Which approved snapshot does it represent? | Approved roster on 30 September |
| Unit | What is included and excluded? | Product division, regional team, or program |
| Decision | What action should the reader take? | Hire, escalate, approve, or coordinate |
| Relationship rule | What does each line style mean? | Solid line is line management; dotted line is advisory |
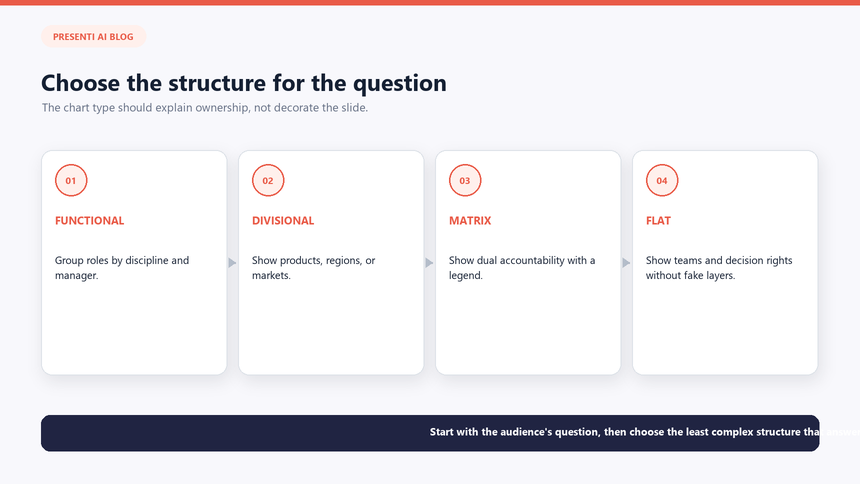
Keep the purpose visible in a subtitle or opening slide. If the audience needs a directory, show contact details in an appendix or linked system. If the audience needs to understand a reorganization, show the current state and the proposed state as two clearly dated views. Never imply that a reporting line proves expertise, performance, seniority, or employment status beyond what the source record says.
Which Slides Belong in an Organization Chart Deck?
A concise deck usually needs a context slide, one or two current-state views, a role-and-accountability view, and a change or action view. The organizational structure slide should be readable at normal presentation size; a giant all-company tree that requires zooming is better treated as a reference appendix.
- Purpose and scope. Name the audience, as-of date, business unit, relationship legend, and decision.
- Executive snapshot. State the structural fact that matters: a missing owner, a new layer, a planned team, or a handoff risk.
- Current reporting view. Show the top-level leader, direct reports, and the few levels needed for the decision.
- Function or team views. Split dense branches into department slides with the same title and line conventions.
- Role cards. Add mission, key accountabilities, decision rights, and status for roles that the audience must understand.
- Collaboration map. Show important cross-functional or dotted-line relationships separately from line management.
- Future-state view. Mark proposed, vacant, interim, or sunset roles with a legend and an effective date.
- Actions and owners. Assign the next staffing, communication, approval, or review action and its owner.
Apply the same reading order on every slide: leader or accountable role first, then direct reports from left to right, then supporting relationships. Repeat the legend and as-of date in a small footer. That repetition helps a new reader interpret a department slide when it is shared without the rest of the deck.
How Do You Keep an Organization Hierarchy Chart Readable?
Readability comes from reducing ambiguity before reducing font size. A company hierarchy chart should use one box for one role, one connector convention for each relationship type, and enough white space for the eye to follow a branch. Keep names optional when the decision concerns positions rather than individuals. If several people share a role, show the role once and add an approved headcount or location field instead of repeating identical boxes.
Use alignment and grouping to show levels, but do not use color as the only signal. A planned role can have a dashed outline and the word "planned"; a dotted-line relationship can use a dashed connector plus a legend. The W3C Web Content Accessibility Guidelines call for text alternatives for non-text content and sufficient contrast, principles that also make a slide easier to print, share, and read in grayscale.
| Chart element | Recommended rule | Validation check |
|---|---|---|
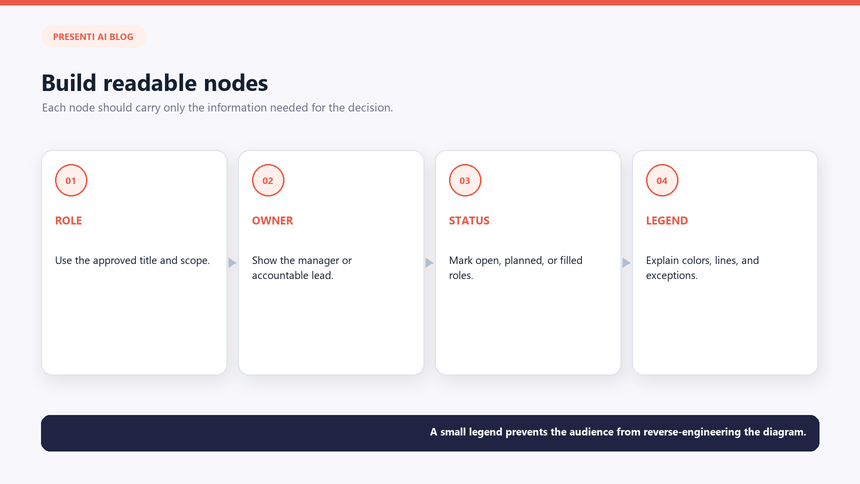
| Role label | Title first; person, location, and status only when needed | Can a reader identify the role in two seconds? |
| Connector | Solid for formal manager; dashed for advisory or project link | Does the legend explain every line style? |
| Level | Keep equivalent roles on a shared baseline | Are peers visually comparable without color? |
| Branch | Split a dense function into a dedicated slide | Is body text readable at 100% view? |
| Status | Use explicit words such as current, vacant, interim, or planned | Can a reader distinguish fact from proposal? |
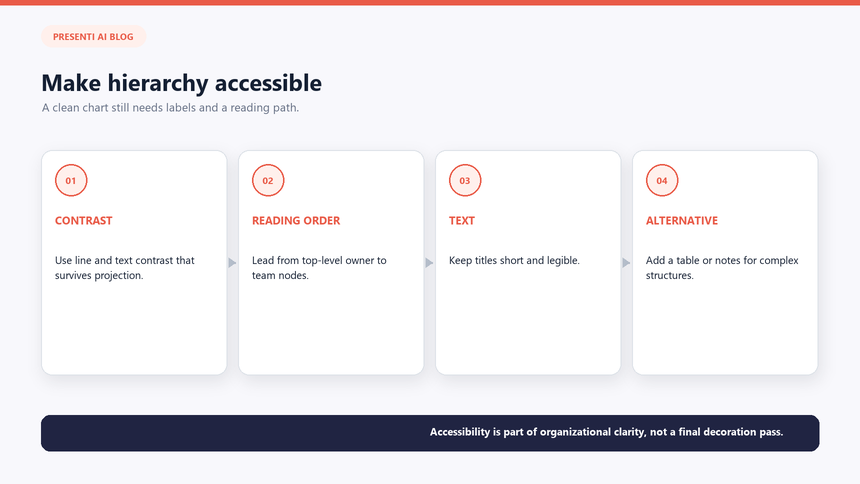
Before sharing, test the slide on a laptop, a projected view, and a printed page if the audience uses all three. Check that connectors do not cross role labels, that the smallest text survives the intended format, and that the reading order still makes sense when the slide is exported to PDF. Provide a text summary or accessible notes for a complex diagram rather than assuming the image is self-explanatory.
How Should the Chart Show Team Growth and Change?
Growth is a comparison between approved states, not a promise that every proposed box will be filled. Show the current structure, the target date, and the conditions that move a role from proposed to approved. A future-state slide can include planned roles, reporting changes, and temporary arrangements, but each must carry a status and an owner for the next decision.
The UK Government's GovS 003 people standard notes that structures can include formal reporting lines alongside matrix or networked ways of working, and that workforce planning should consider future size, shape, composition, locations, capabilities, and skills. Use that distinction in the deck: show line management in the main hierarchy, then show matrix or project connections in a separate view.
| Change question | What to show | Trigger or check |
|---|---|---|
| What is changing? | Role, team, manager, location, or decision right | Approved proposal and effective date |
| Why now? | Launch, workload, risk, capability gap, or service change | Evidence owner and decision record |
| What stays stable? | Unchanged functions and existing escalation path | Compare against the current snapshot |
| What is the next gate? | Hire, budget, consultation, training, or handoff | Named owner, due date, and approval status |
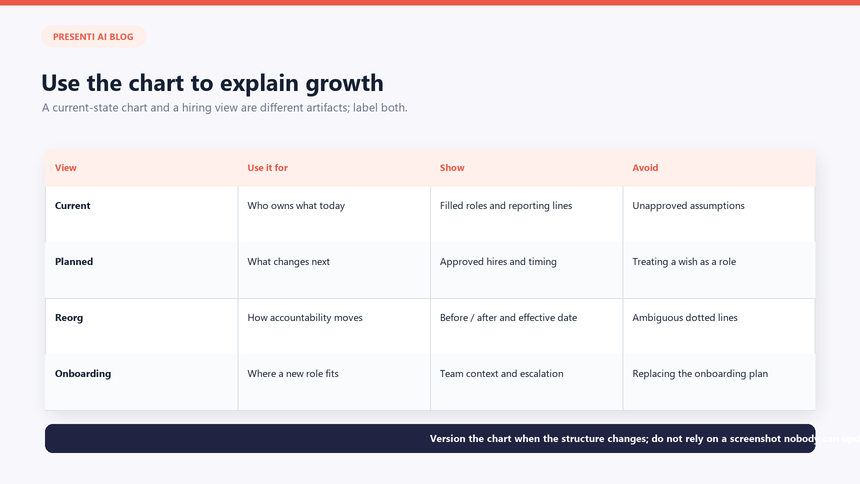
Use a small scenario table when the future is uncertain: base case, accelerated case, and constrained case. Keep headcount assumptions separate from commitments, and do not publish compensation, performance notes, or personal circumstances in a broad audience deck. A change log on the final slide or in the appendix makes later updates easier to audit.
What Does a Practical Organization Chart Example Look Like?
Consider a fictional software company, Northstar Field Service, preparing for a regional launch. Its current team has a general manager, product lead, engineering lead, customer operations lead, and a shared finance partner. The launch requires a regional implementation lead and a support specialist, but the budget gate has not yet been approved. The useful presentation is not a list of names; it is a clear choice about which roles must be staffed first and how escalation will work during the launch.
| Role or relationship | Current state | Target state | Decision or check |
|---|---|---|---|
| General manager | Accountable for the unit | Remains accountable | Approve launch gates and priorities |
| Regional implementation lead | Not filled | Planned direct report | Open role after budget approval |
| Support specialist | Shared with another region | Dedicated after pilot | Measure ticket volume and response risk |
| Finance partner | Dotted-line advisor | Dotted-line advisor | Review margin and hiring case |
| Product and engineering | Separate leads | Same line managers; launch squad link | Publish a temporary collaboration rule |
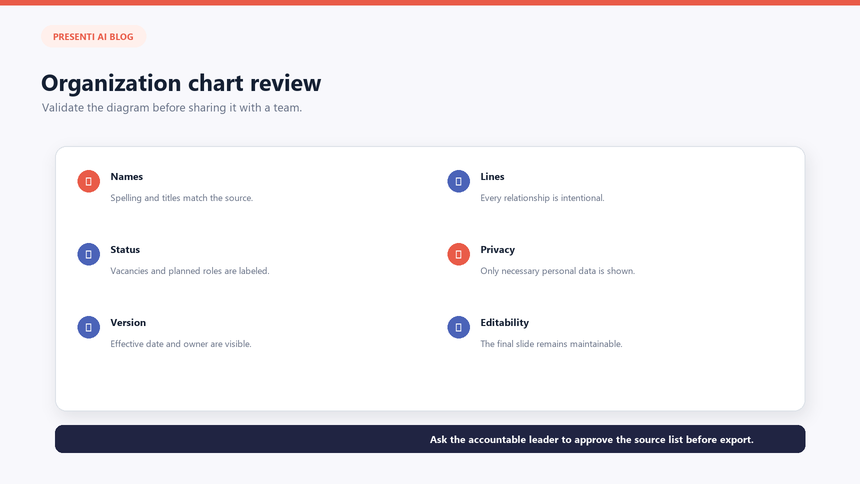
The recommendation can now be stated plainly: approve the implementation lead first, keep finance advisory, and make the support hire conditional on pilot demand. The appendix can hold the complete roster and role descriptions. The core slides carry the decision, the evidence, and the next gate, so an executive can review the structure without reading every employee record.
How Can Presenti Turn a Role List into an Editable Deck?
Presenti can help turn a checked role list into an editable first draft. Use text to presentation when the source is a planning note, approved roster, or role matrix. Choose a layout from the Presenti presentation template collection only after the outline makes the reporting logic clear. Presenti organizes the draft; people, operations, finance, and legal owners still approve the relationships and the final communication.
Step 1: Prepare a role list with provenance
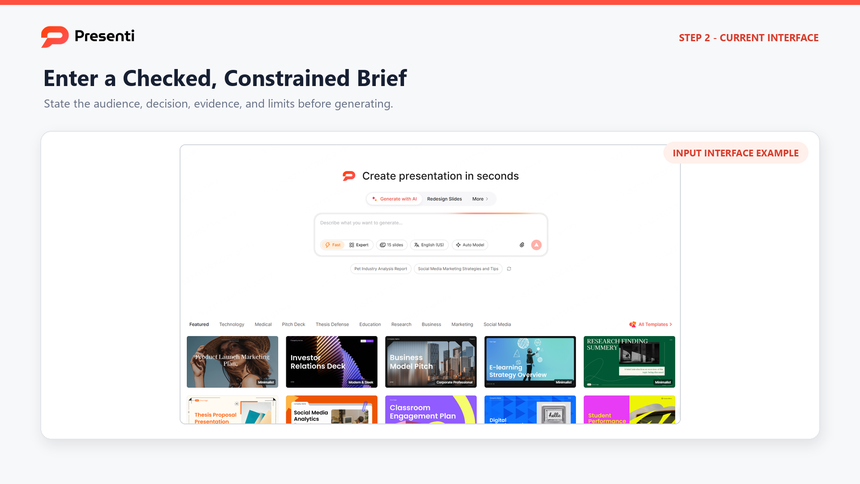
Start with one row per role: title, function, manager, relationship type, location, status, decision rights, effective date, and source owner. Use role codes instead of personal names when the audience does not need identities. Remove compensation, performance notes, employee IDs, and private comments. Add a version number and an as-of date before submitting the brief.
Step 2: Review the outline before styling
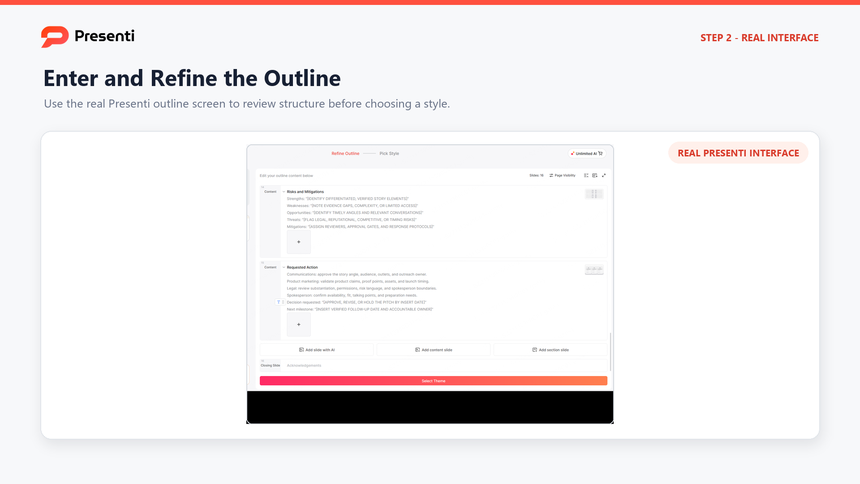
Ask for a sequence that moves from purpose to current structure, role accountability, collaboration rules, future state, and actions. Check that each proposed role is labeled as proposed and that the outline does not turn a directory into a performance assessment. Merge repeated department slides and add a dedicated legend when the line conventions are not obvious.
Step 3: Choose a template that supports hierarchy
Preview a hierarchy, comparison, or timeline layout after the structure is approved. If someone asks for an organization chart PowerPoint template, treat the layout as a starting point rather than a source of truth. Prefer readable role cards, consistent spacing, and a visible legend over decorative photos or color-only distinctions.

Step 4: Review the editable deck with role owners
Compare every box with the approved roster. Check manager names or role codes, vacant and interim status, line styles, effective dates, and the action owner. Test the reading order with someone outside the design work. The chart should explain accountability without exposing data that the audience is not authorized to see.

Step 5: Run privacy, accessibility, and version checks
Before export, add a text summary for complex diagrams, verify contrast and non-color status cues, and check that labels remain legible in the intended file format. Confirm the version number, as-of date, source owner, approval state, and distribution list. Reopen the exported file to catch shifted connectors, missing fonts, clipped labels, or an outdated future-state branch.
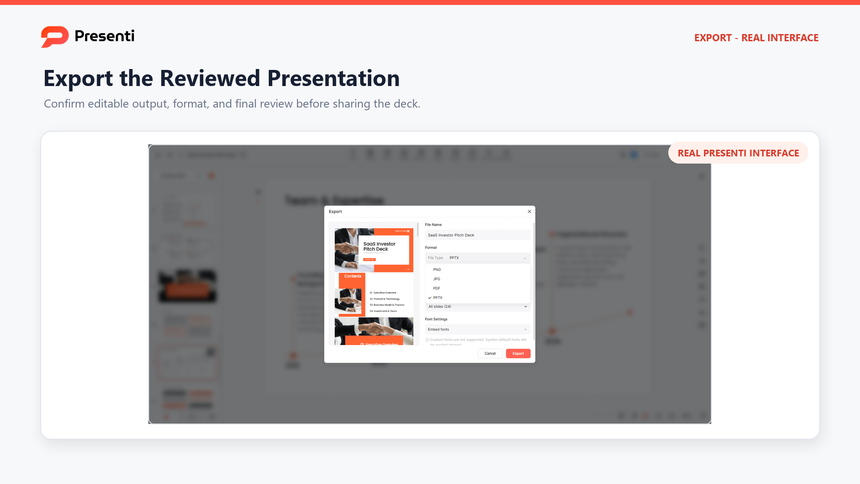
The result is an editable draft that shortens formatting work while leaving the consequential judgment with the team. Keep the approved roster, change log, and final deck together so the next update can be traced to a source rather than rebuilt from memory.
Frequently Asked Questions
How often should an organization chart template be updated?
Update it when an approved role, manager, team boundary, or decision right changes, and show the as-of date on every shared version. A scheduled monthly or quarterly check can catch drift, but it should not replace an update triggered by a reorganization or hire.
Should an org chart show people or positions?
Use positions when the audience needs accountability, hiring, or capability planning. Add names only when identity is necessary for the decision and the distribution is authorized. A role-first view is easier to reuse and less likely to expose personal information.
How do I show a dotted-line relationship?
Use a distinct connector style, a written legend, and a short statement of the advisory or project responsibility. Do not make a dotted line look equivalent to a manager relationship, and do not rely on color alone to distinguish it.
Can a chart include future hires?
Yes. Label each future role as planned, proposed, vacant, or conditional, and include the approval gate, target date, and owner. Keep the current-state view separate so readers do not mistake a scenario for an approved roster.
Is an organization chart the same as a RACI matrix?
No. An organization chart primarily shows formal reporting and accountability relationships. A RACI matrix assigns responsibility, accountability, consultation, and information for a specific activity. Use both when the audience needs structure and task-level decision clarity.
Bottom Line
An organization chart presentation should make reporting lines and responsibilities easy to understand. Date the chart, explain solid and dotted lines, and show proposed roles separately from current ones. Use a team-level view when the full chart makes names and relationships too small to read.
Add a decision layer to the organization chart
Put a version date and source beside the chart. Separate the current reporting lines from proposed roles, dotted-line relationships and future hiring assumptions. A reader should be able to tell which boxes describe today and which boxes ask for approval.
A practical six-slide sequence is current structure, change drivers, proposed structure, role and capacity assumptions, risks or privacy notes, and the decision request. Keep names and personal details to the minimum needed for the meeting; an organization chart can expose more information than the decision requires.
Before export, check labels at presentation distance and confirm that the legend explains solid, dotted and vacant roles. This turns a decorative hierarchy into a deck that supports one recorded decision.