A social media report presentation should answer three questions: what happened, why it happened, and what the team will change next. A useful monthly deck connects channel metrics to the business objective, separates evidence from interpretation, and ends with named actions. It should not be a gallery of platform screenshots or a list of every number available in the analytics export.
This guide provides an eight-slide reporting template, a cadence and audience decision table, a KPI selection method, and a worked example for turning social performance into a clear management or client conversation.
For forward-looking audience, channel, editorial, and resource decisions, use a separate content strategy presentation.

What Should a Social Media Report Presentation Answer?
The report is a management tool, not a data archive. It should create a shared view of performance and lead to a decision about content, audience, channel, spend, or execution.
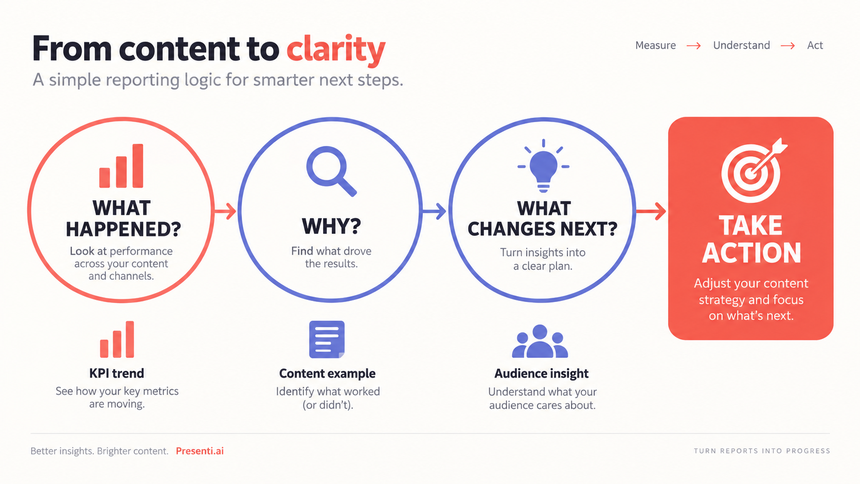
Organize the story around three questions:
- What happened? Show the outcome against a target, prior period, or meaningful benchmark.
- Why? Identify the content, audience, distribution, campaign, seasonality, tracking change, or external event that plausibly explains the movement.
- What changes next? State the decision or test, the owner, the timing, and the metric that will determine whether it worked.
Do not claim causation from a simple correlation. If reach rose after posting frequency changed, label that as an observation until another test or source supports the explanation. Keep platform definitions visible because metrics with the same name can be calculated differently across tools or change over time.
How Should You Match the Report to Audience and Cadence?
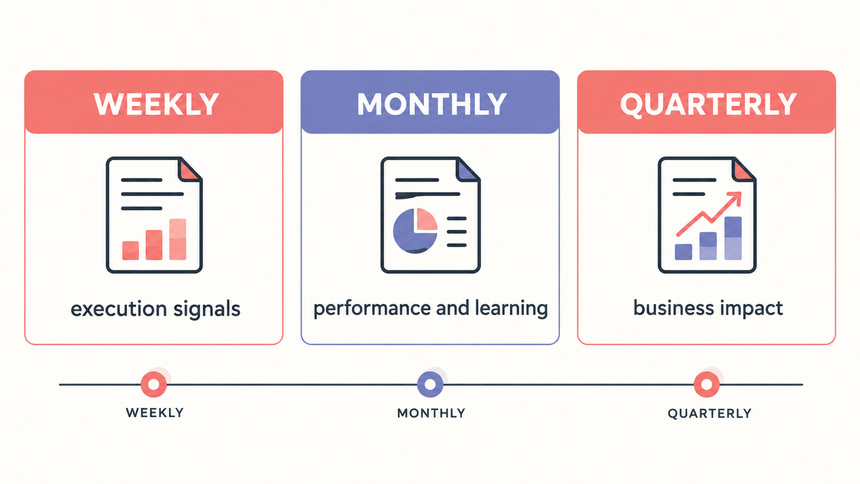
A weekly operating report, monthly performance review, and quarterly business review have different jobs. Reusing the same slide sequence for all three creates either noise or missing context.
| Cadence | Primary audience | Main question | What belongs in the deck |
|---|---|---|---|
| Weekly | Social and content team | Is execution working as planned? | Publishing health, early signals, issues, tests, and immediate actions |
| Monthly | Marketing lead or client | What changed and what did we learn? | Outcome scorecard, channel shifts, content drivers, audience quality, and next-month plan |
| Quarterly | Executives or cross-functional leaders | How did social contribute to business priorities? | Business outcomes, major trends, strategic learning, resource choices, and next-quarter priorities |
| Campaign close | Campaign owner and stakeholders | Did the campaign achieve its objective? | Objective, delivery, outcome, audience response, creative learning, spend context, and recommendation |
Change the level of detail, not the metric definitions. If the monthly deck says engagement rate uses engagements divided by impressions, the quarterly comparison should not silently switch to followers as the denominator. Record the formula, source, timezone, reporting period, and any known tracking break.
What Should Go on an Eight-Slide Report?
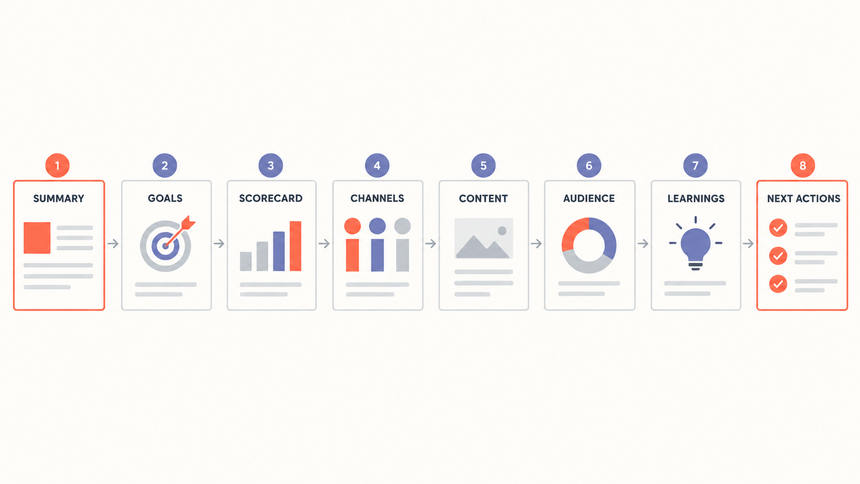
For a monthly management or client review, the following sequence is a strong starting point. Add appendix slides for platform detail instead of crowding the main narrative.
- Executive summary. State the biggest outcome, the driver, the risk or limitation, and the next action.
- Objective and social's assigned role. Restate whether the program is meant to create awareness, demand, community, support, retention, or another result.
- KPI scorecard. Compare actual performance with target and prior period using consistent definitions.
- Channel contribution. Show which platforms contributed to the outcome and which changed materially.
- Content performance. Compare the strongest and weakest content by format, topic, audience, or distribution choice, not only by individual post.
- Audience and traffic quality. Add audience mix, qualified visits, leads, assisted conversions, or other downstream evidence when available and appropriate.
- Learning and limitations. Separate what the data proves, what the team believes, and what still needs a test.
- Next actions. Name three to five decisions or experiments with owners, dates, and success measures.
For platform goals, content pillars, and campaign planning, keep the report connected to the existing social media strategy template. The report measures and changes the strategy; it should not rewrite the strategy on every slide.
Which KPIs Support the Decision?
Start with the business or communication objective, then work backward to the minimum KPI stack. A useful stack has four layers:
| Layer | Question | Possible measures | Reporting caution |
|---|---|---|---|
| Outcome | Did social contribute to the intended result? | Qualified traffic, leads, sales, registrations, retention signal, support resolution | Attribution may be partial or model-dependent |
| Response | Did the audience take the desired channel action? | Clicks, saves, replies, shares, video completion, direct messages | Definitions differ by platform and format |
| Distribution | Did the content reach the intended audience? | Reach, impressions, frequency, follower or subscriber change | More exposure is not automatically better exposure |
| Execution | Did the team deliver the plan? | Posts published, response time, production cycle, campaign pacing | Activity is not an outcome |
Do not call a metric "vanity" merely because it sits high in the funnel. Reach can matter when the assigned job is awareness. The problem is using a metric without explaining its role. Pair every KPI with a target or comparison and a sentence that states what decision it informs.
Separate organic and paid performance when the investment, targeting, and expected outcome differ. Also identify tracking gaps. A broken UTM convention, consent change, platform definition update, or incomplete CRM match can explain a reported movement as easily as a new content idea.
Maintain a metric dictionary
Keep a short reporting dictionary outside the deck and include the critical definitions in the appendix. For each KPI, record the platform or analytics source, formula, denominator, attribution window, timezone, owner, and known limitation. This reduces false month-to-month movement caused by a changed calculation rather than changed performance.
When a platform changes a metric or export, mark the break in the trend. Do not silently splice incompatible periods together. If the audience needs continuity, show the comparable subset and explain what was excluded. The goal is a decision that can be defended later, not a perfectly smooth chart.
How Do You Turn Platform Data into an Insight and Action?
Imagine that total reach increased during the month, but high-intent clicks declined. The top posts were broad educational carousels, while product-proof posts were published less often. The report should not conclude that the social program improved simply because reach rose.
A slide could state: "Reach rose, but clicks to product-proof pages fell while the content mix shifted away from proof-led posts." The evidence block would show reach, high-intent clicks, content mix, and any paid distribution change using consistent periods. The next action could be: "Restore two proof-led posts per week for four weeks; measure the product-proof link click ratio and assisted leads; owner: demand generation lead."
A two-period example you can calculate
Assume two equal 28-day windows for the same account on one platform, using organic posts only. The figures below are fictional. Keep the platform definitions and reporting cutoff consistent.
| Measure | Earlier window | Later window | Change |
|---|---|---|---|
| Platform-reported reach | 60,000 | 90,000 | +50% |
| Impressions | 100,000 | 150,000 | +50% |
| Link clicks to product-proof pages | 1,500 | 1,200 | −20% |
| Product-proof link clicks ÷ all organic impressions | 1.5% | 0.8% | −0.7 percentage points |
The last row is a custom reporting ratio: 1,500 ÷ 100,000 = 1.5%, then 1,200 ÷ 150,000 = 0.8%. Its denominator includes impressions from all organic posts in the window, not only posts linking to product-proof pages. Do not label it as the platform’s standard click-through rate. The relative decline is about 46.7%; that is different from a drop of 0.7 percentage points.
Here, “high-intent” is shorthand for the link destination, not proof of a visitor’s purchase intent. Keep link clicks separate from website sessions: Google defines a GA4 session as a period of interaction with a site or app. A platform click count is not the same measure.
This comparison supports a narrower finding: exposure rose while fewer clicks went to the selected pages. It does not show that the content mix caused the decline. Check posting volume, link placement, audience mix, and tracking changes before choosing the next test. The illustration below shows a separate six-month trend; its plotted values are not the two-window example above.
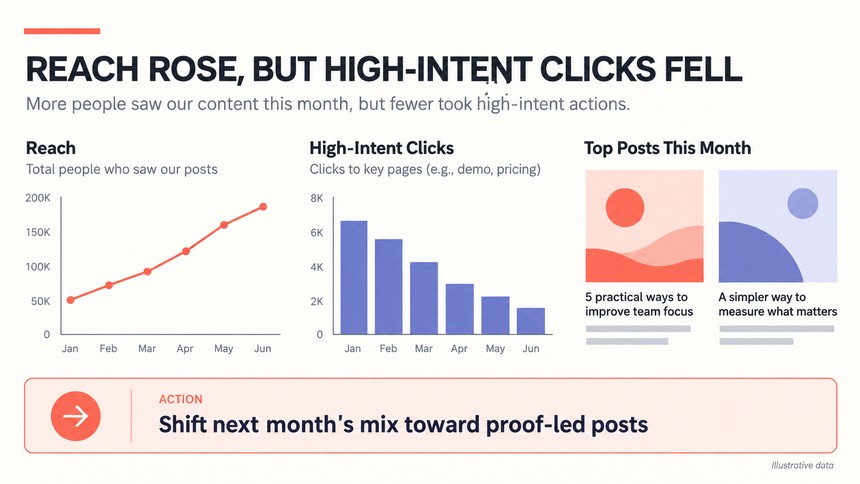
The example is illustrative, not a performance benchmark. Your conclusion must come from your own exports, definitions, and business context. The same discipline appears in an SEO report presentation: compare, diagnose, decide, assign, and review.
Use a finding ledger before building slides
For each proposed takeaway, record the supporting metric, comparison period, content examples, alternative explanation, confidence level, and next test. Promote only the findings that change a decision into the main deck. Keep unresolved observations in the appendix or label them as hypotheses.
This ledger also prevents cherry-picking. If the strongest post had paid amplification, a celebrity mention, an unusually long run time, or a different objective, do not present it as proof that the format alone caused the result. Make the confounding condition visible and design the next test around it.
How Can Presenti Speed Up the Reporting Workflow?
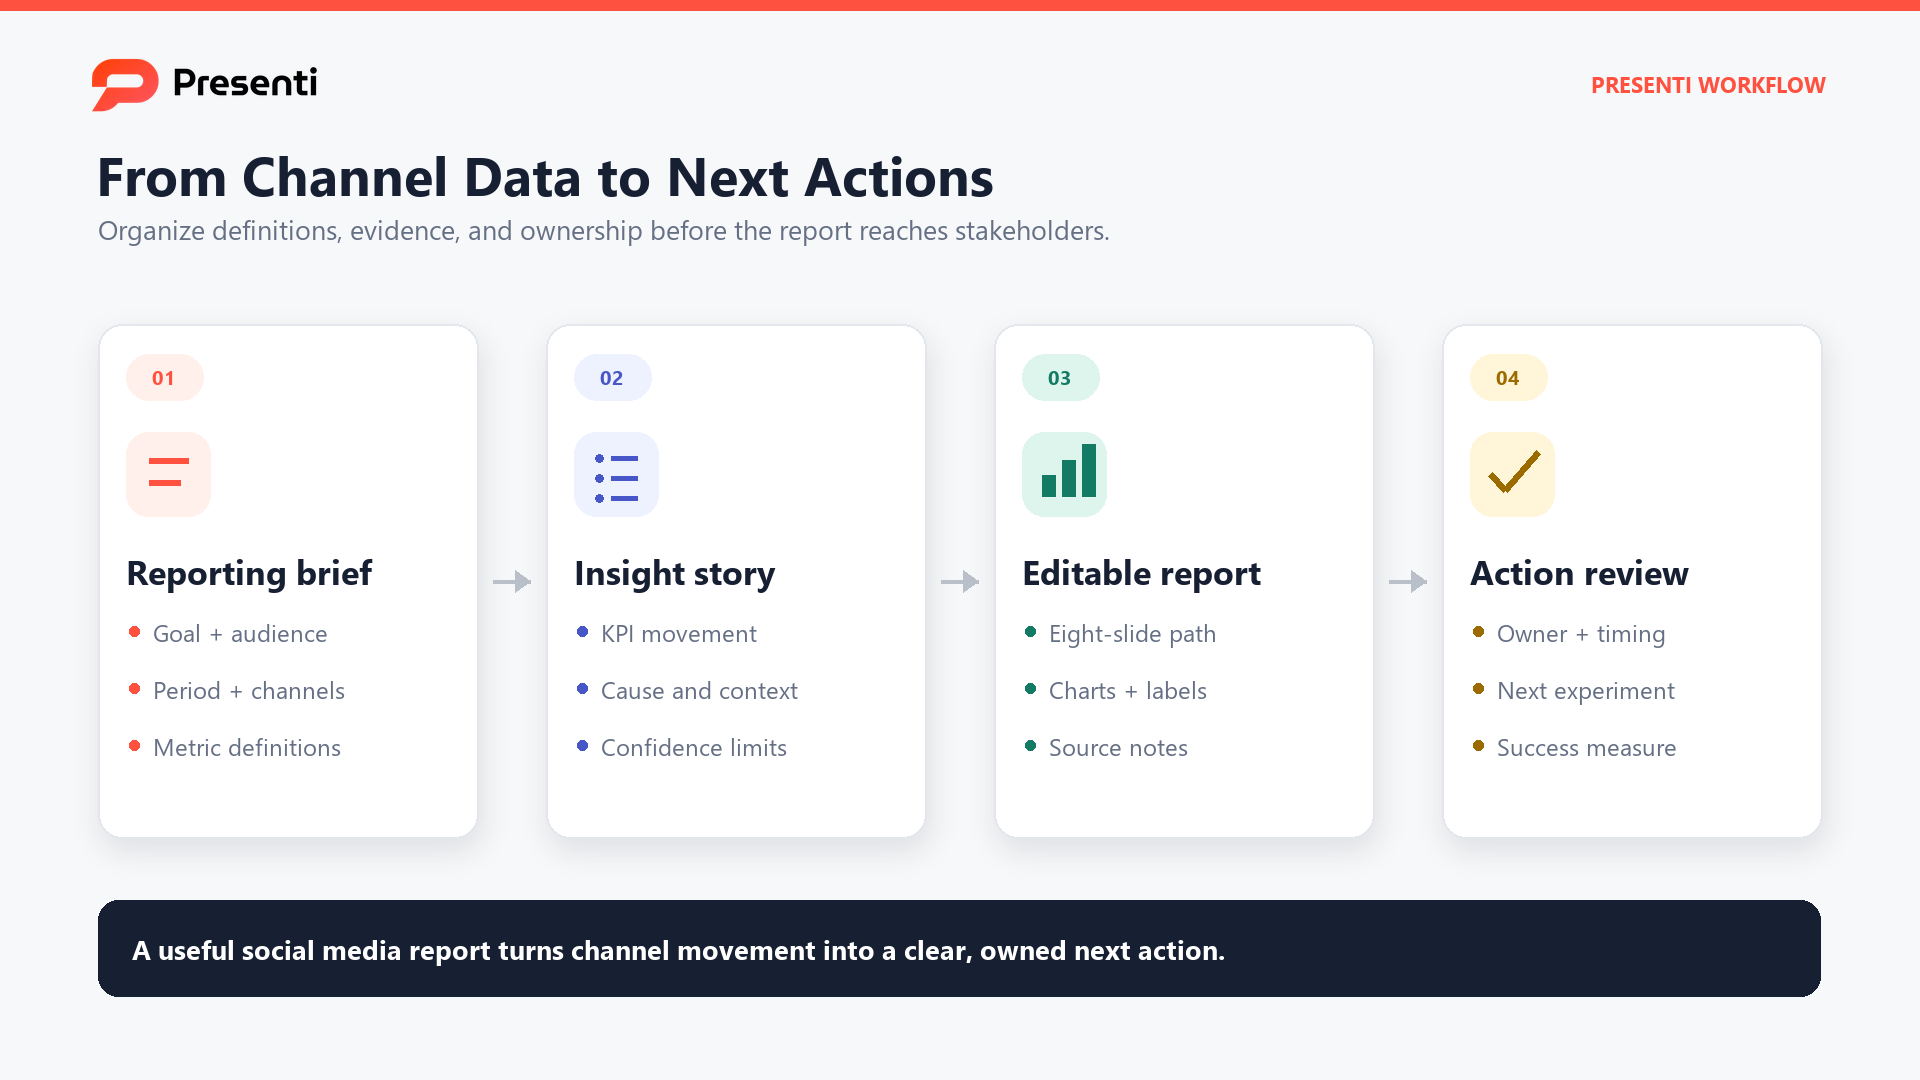
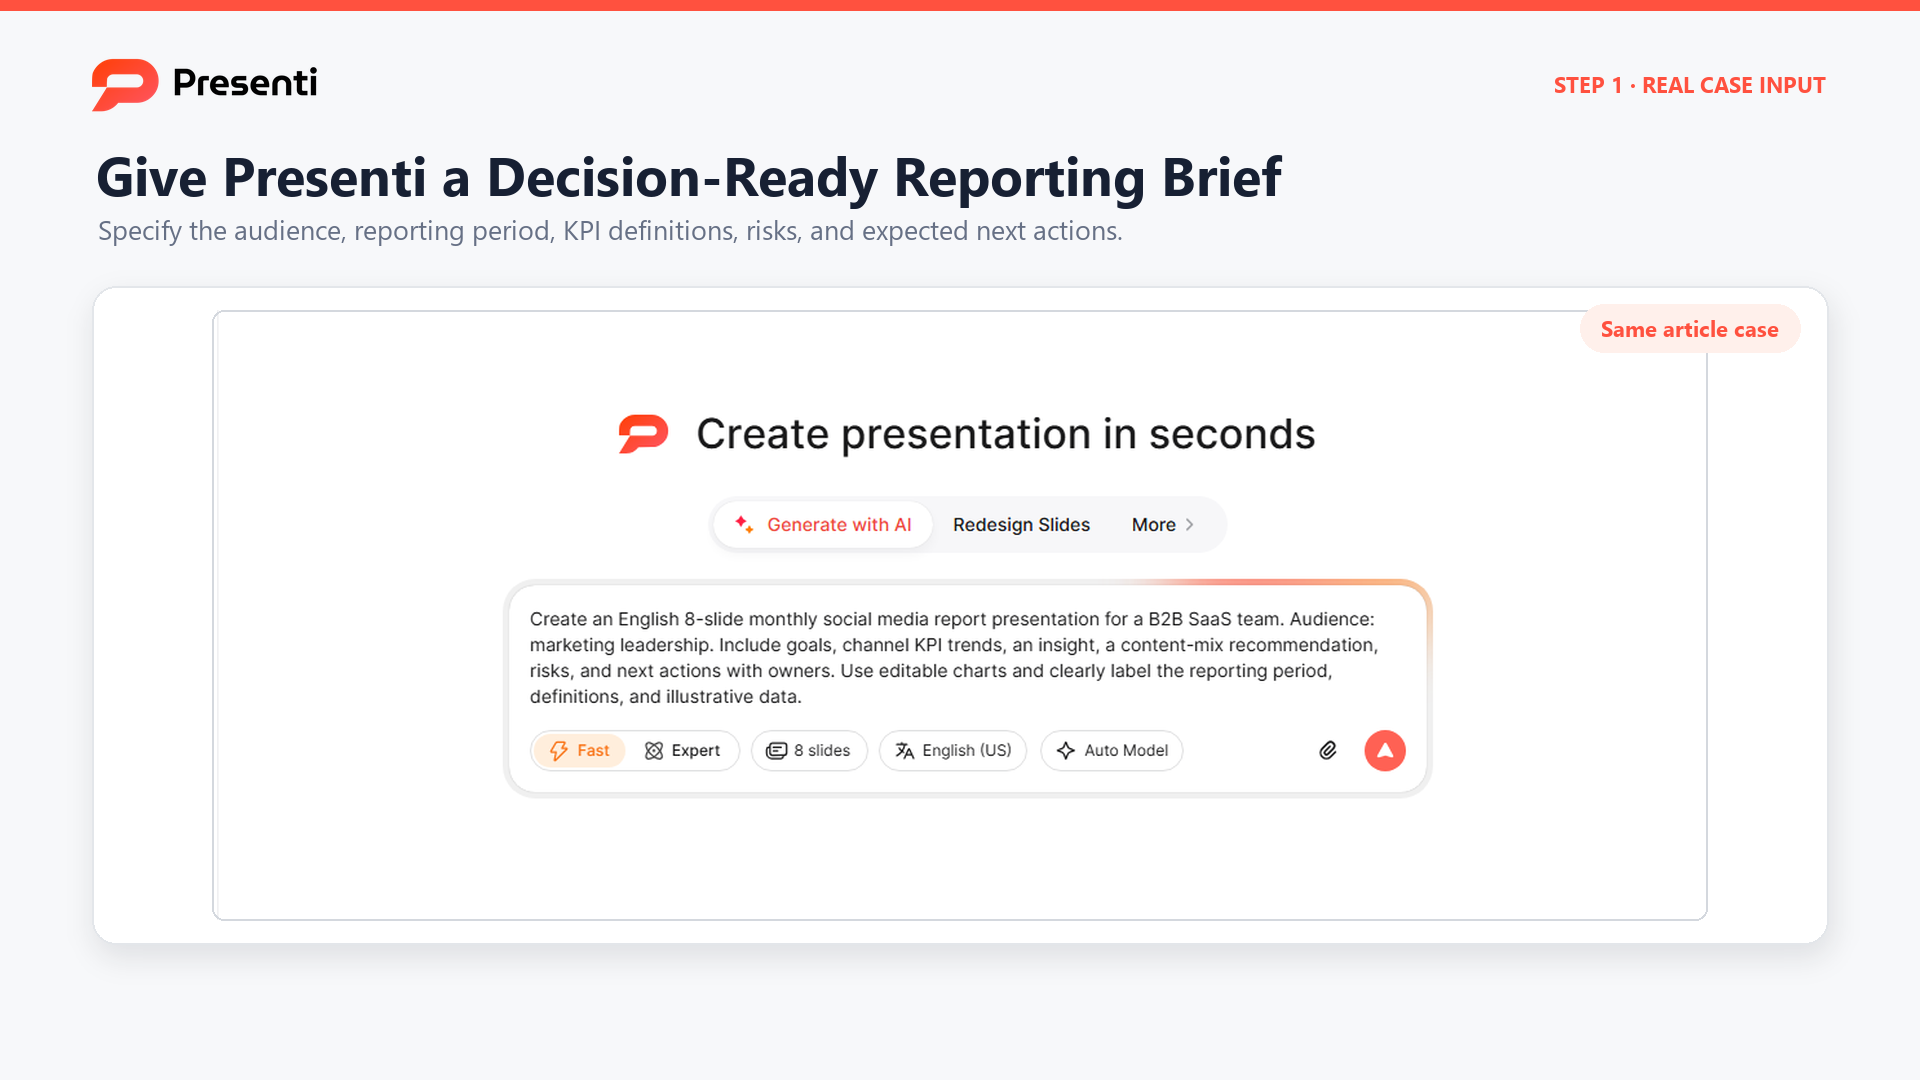
Prepare a clean reporting brief before generating slides. Include the audience, period, business objective, approved KPI definitions, key findings, limitations, and next actions. Use tables or structured notes rather than pasting conflicting screenshots with no explanation. Do not include confidential or personal data unless your organization's policy permits it.
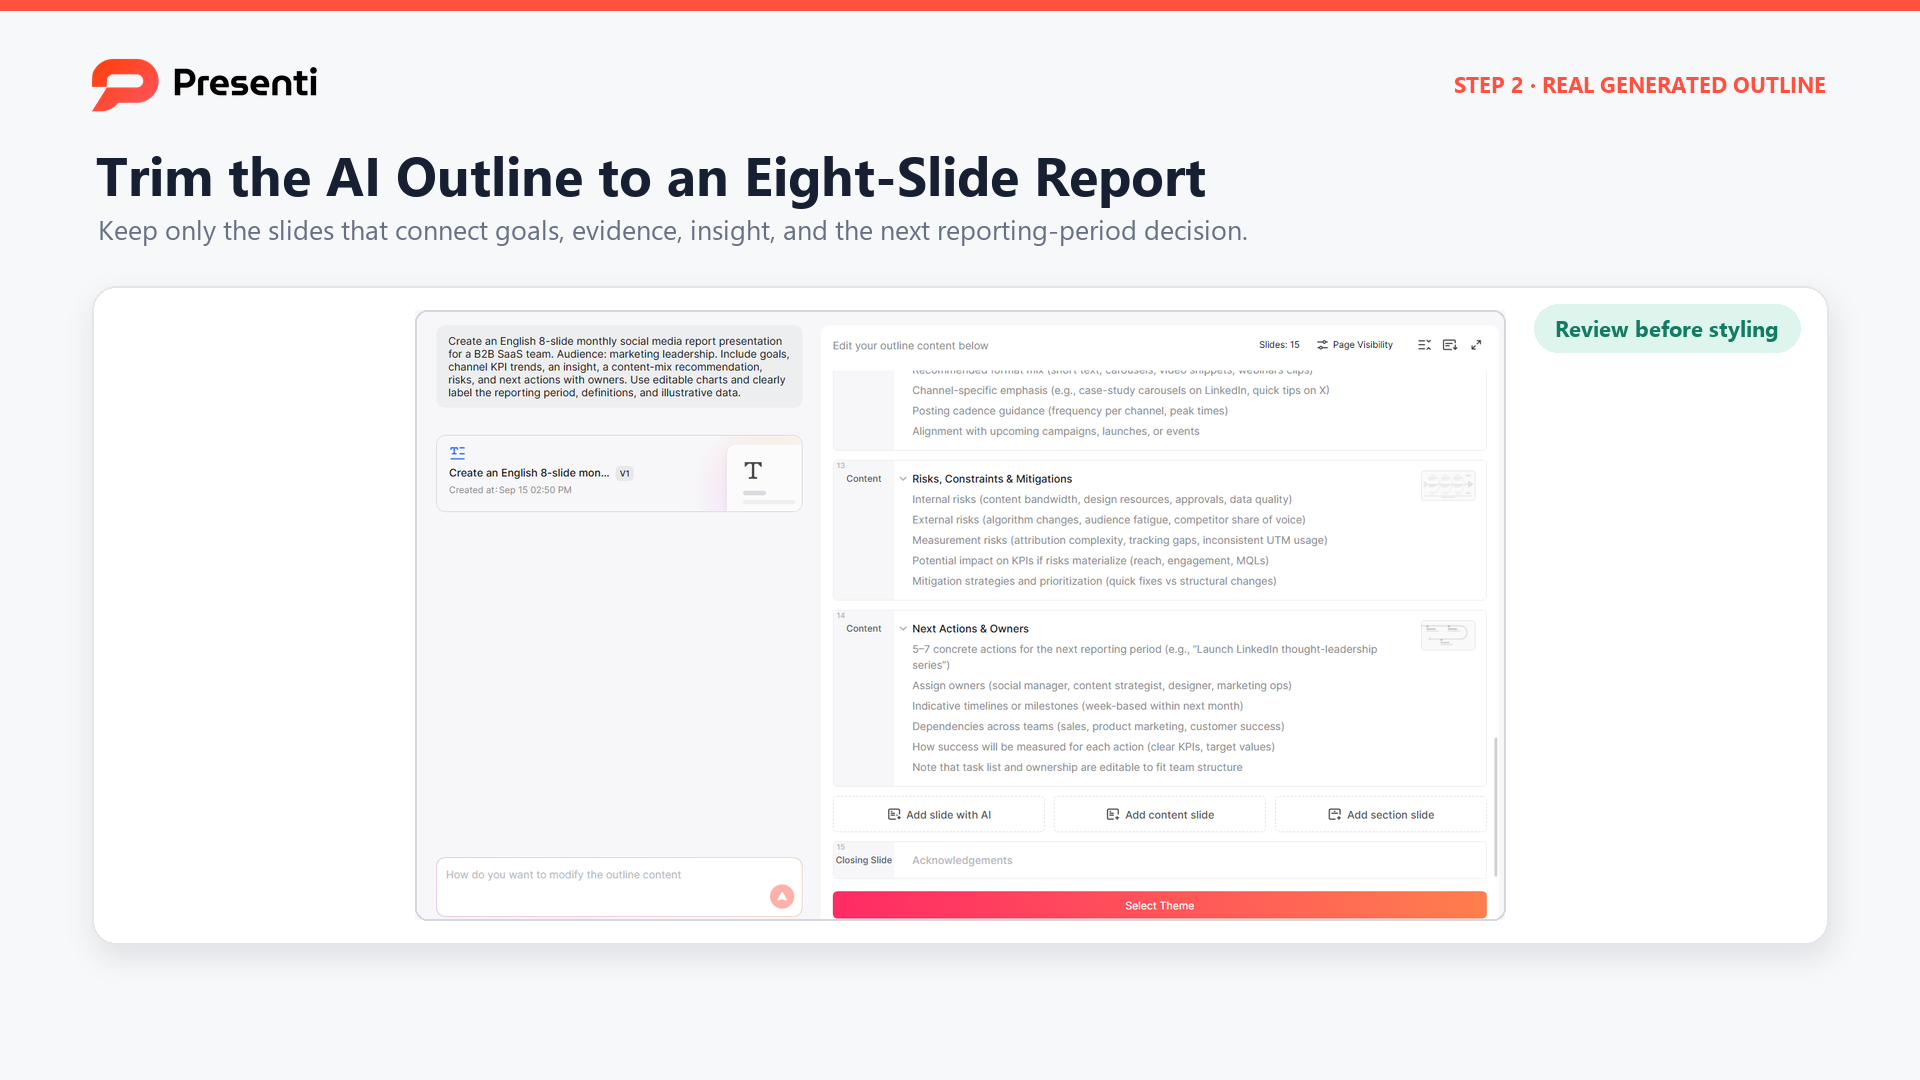
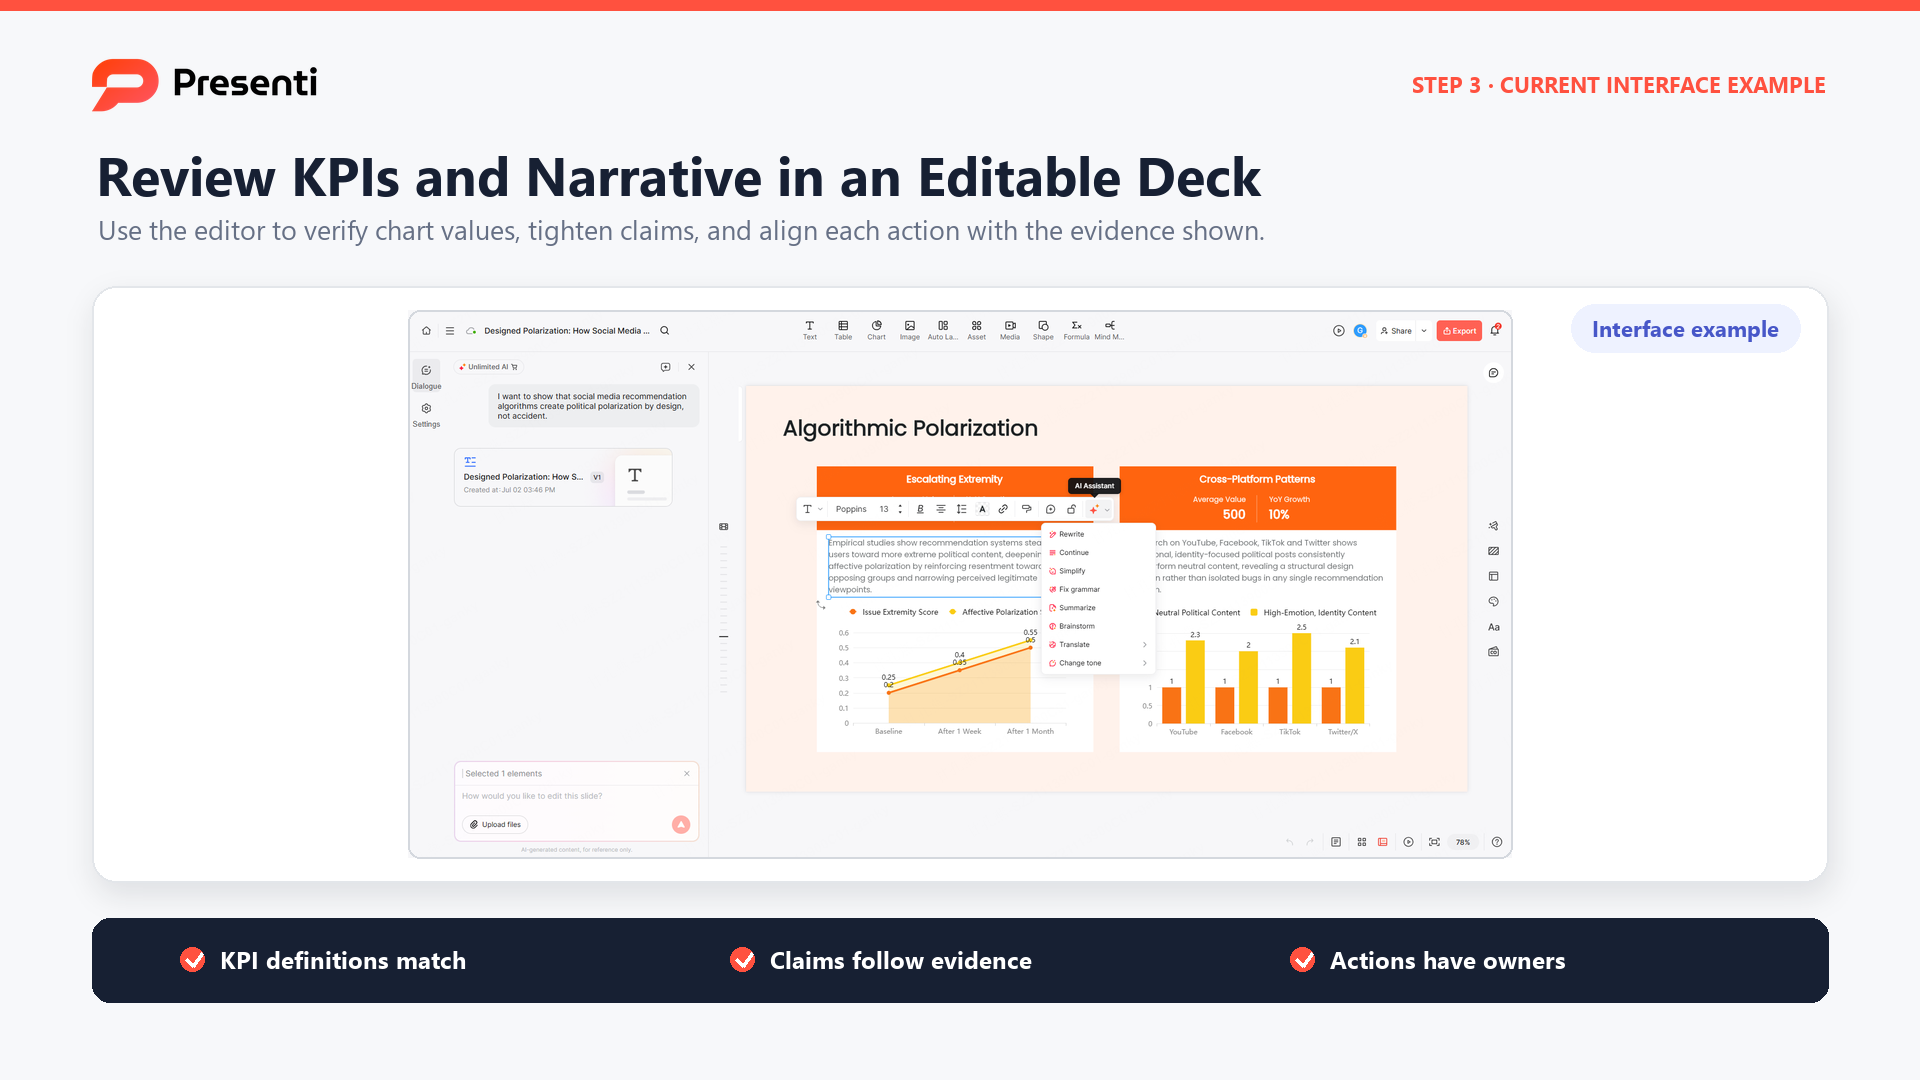
Presenti can help turn that brief into an editable presentation draft. Review the slide order, remove unsupported explanations, check every number against the source, and replace generic headings with verified conclusions. Add source notes and an appendix when the audience may need to audit the calculation.
Before delivery, ask someone who did not prepare the analysis to read only the slide titles. They should be able to explain the performance story and the next action. Then ask them to inspect one claim back to its source. If either task fails, revise the narrative or evidence path before the meeting.
Frequently Asked Questions
What should be included in a monthly social media report?
Include an executive summary, objective, KPI scorecard, channel contribution, content performance, audience or traffic quality, key learning, limitations, and named next actions. Put detailed platform exports in an appendix when they do not change the main decision.
How long should a social media report presentation be?
For a monthly management or client conversation, eight main slides is a useful starting structure, not a rule. Add or remove pages according to the audience and decision. Keep the primary deck concise and move diagnostic detail to an appendix.
Which social media metrics matter most?
The right metrics depend on the job assigned to social. Start with the intended business or communication outcome, then add response, distribution, and execution measures that explain progress. Keep definitions and comparisons consistent.
Should social media reports show every platform?
Show platforms that materially affect the outcome or require a decision. A complete appendix can preserve platform detail, while the main deck compares contribution and learning. Do not give every platform equal space by default.
How do I report social media ROI?
Define the outcome, costs, attribution method, and time window before calculating return. State what is directly measured, modeled, assisted, or unknown. Avoid assigning all revenue to social when the evidence supports only one part of the customer journey.